Posted On: 02/22/2016 11:04:22 PM
Post# of 2561

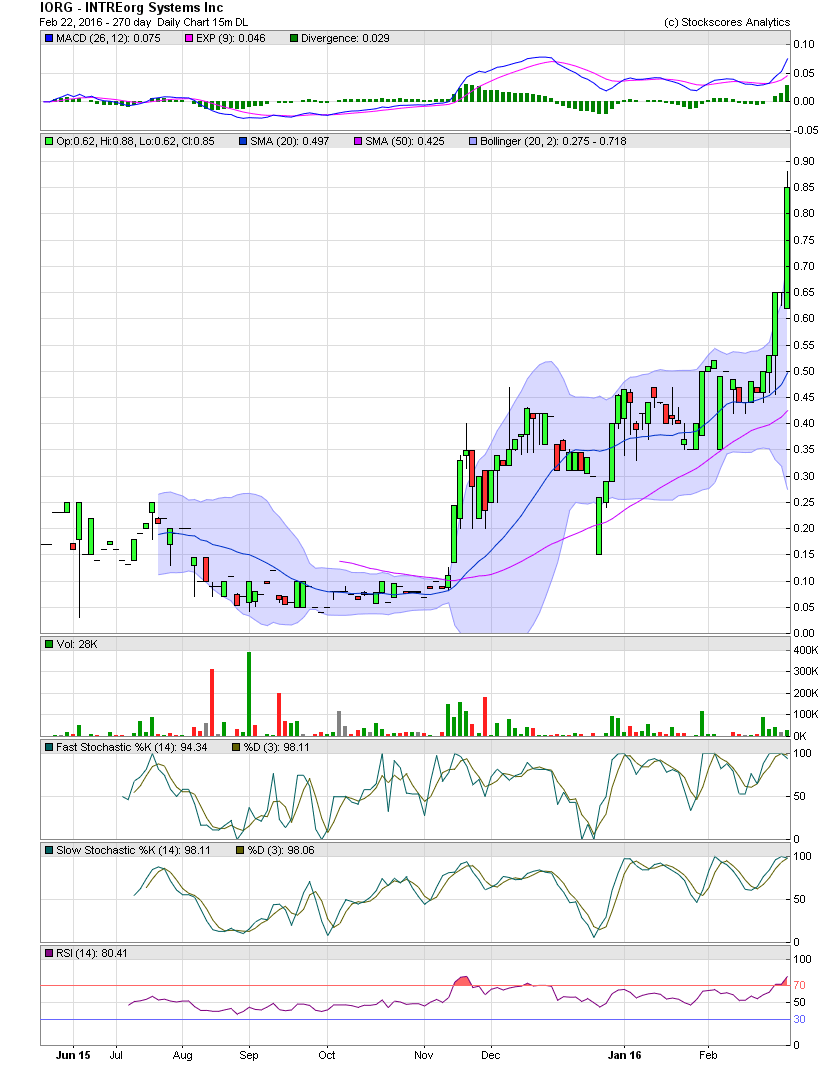
IORG Daily Chart ~ Highest Close Since July 2011
I normally don't post back to back charts, but this one is simply to show the continuation of the move since sub .10 in mid November into today's close of .85 after hitting an intraday high of .88. IORG has seen strong appreciation with very little selling into the bids along the way. No doubt the stock is now a bit overbought again. But with the tight float and low share structure, it will be interesting to see when and what type of consolidation might be ahead. I'm guessing any minor pullback will be yet another good level to either enter or add more, as with the previous corrections since the first one in late November. Congrats to all who have taken positions in the stock over the last 3 months. GLTA
I normally don't post back to back charts, but this one is simply to show the continuation of the move since sub .10 in mid November into today's close of .85 after hitting an intraday high of .88. IORG has seen strong appreciation with very little selling into the bids along the way. No doubt the stock is now a bit overbought again. But with the tight float and low share structure, it will be interesting to see when and what type of consolidation might be ahead. I'm guessing any minor pullback will be yet another good level to either enter or add more, as with the previous corrections since the first one in late November. Congrats to all who have taken positions in the stock over the last 3 months. GLTA