Posted On: 02/15/2016 1:36:01 PM
Post# of 2561

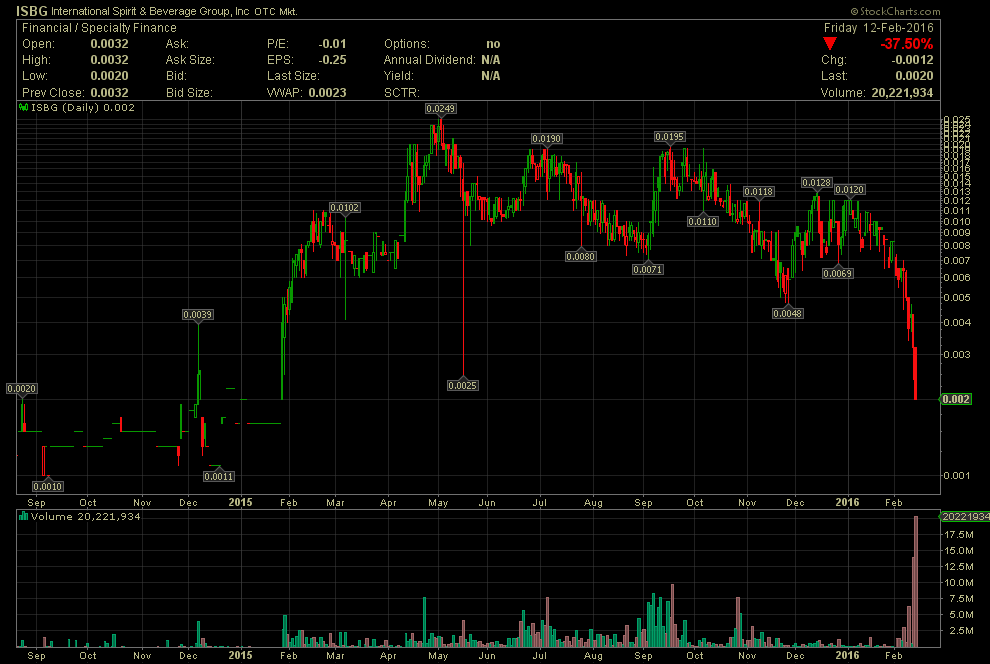
ISBG 18 Month Daily Chart ~ Nearing Levels of Early 2015
As one can see on the chart below, ISBG broke out in February 2015 at the .002 level, which is where the stock is now. Can it trade lower I was asked this morning? Of course it can. Huge selling volume over the last week. Again, my guess only is that conversions or certificates are being liquidated aggressively. I hope it doesn't last much longer.
As one can see on the chart below, ISBG broke out in February 2015 at the .002 level, which is where the stock is now. Can it trade lower I was asked this morning? Of course it can. Huge selling volume over the last week. Again, my guess only is that conversions or certificates are being liquidated aggressively. I hope it doesn't last much longer.