Posted On: 02/15/2016 1:03:25 PM
Post# of 2561

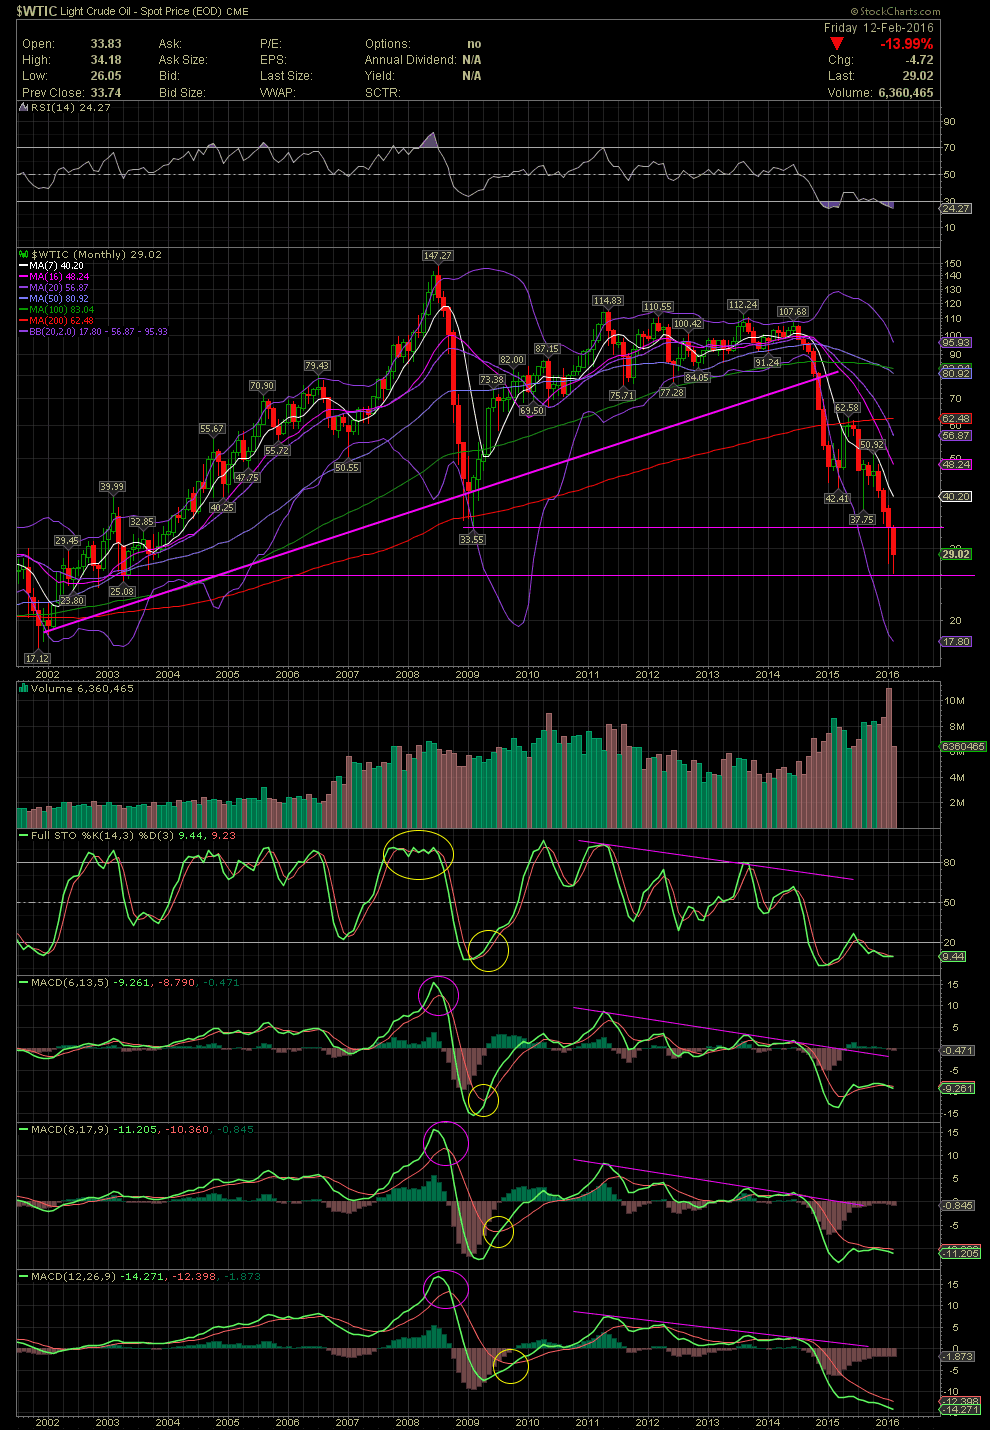
Oil Monthly Chart ~ A 15 Year View
As explained in my previous post, here's a 15 year look at Oil. Lower highs from mid 2011 into mid 2014. The major damage occurred when the Oil Index fell below the long term rising channel in late 2014. An initial break under the MA200, the dead cat bounce back into the moving average, and the subsequent continuation of the long term decline. The very minor support line of early 2009 didn't offer up much. This month's test of the lows of early 2003 have only held for a few days. The long term declines of the FullSto and MACDs tell the story. Lower highs continuously while the price of oil churned for years. Those who use the Weekly and Monthly Charts along with the Daily Charts have seen the trend long before the talking heads on TV put out reasons for a decline, which is usually drivel.
As explained in my previous post, here's a 15 year look at Oil. Lower highs from mid 2011 into mid 2014. The major damage occurred when the Oil Index fell below the long term rising channel in late 2014. An initial break under the MA200, the dead cat bounce back into the moving average, and the subsequent continuation of the long term decline. The very minor support line of early 2009 didn't offer up much. This month's test of the lows of early 2003 have only held for a few days. The long term declines of the FullSto and MACDs tell the story. Lower highs continuously while the price of oil churned for years. Those who use the Weekly and Monthly Charts along with the Daily Charts have seen the trend long before the talking heads on TV put out reasons for a decline, which is usually drivel.