Posted On: 02/12/2016 11:41:11 AM
Post# of 17655
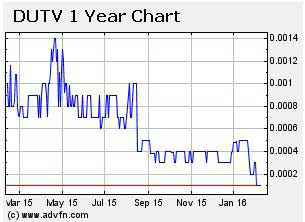
This chart does not square with an oversold SS.

The 3 and 5 year charts do not either.
Can someone give an explanation How the current share price can drop from a 52 week high of .0014 down to .0001 if DUTV SS is oversold?
Shouldn't an oversold SS dry up availability of shares thus halt the drop of the share price?
Can someone provide proof that the SS is oversold?
Shareholders need this information to make informed trading decisions.
Will re-post if necessary.

