Posted On: 01/31/2016 1:45:03 PM
Post# of 2561

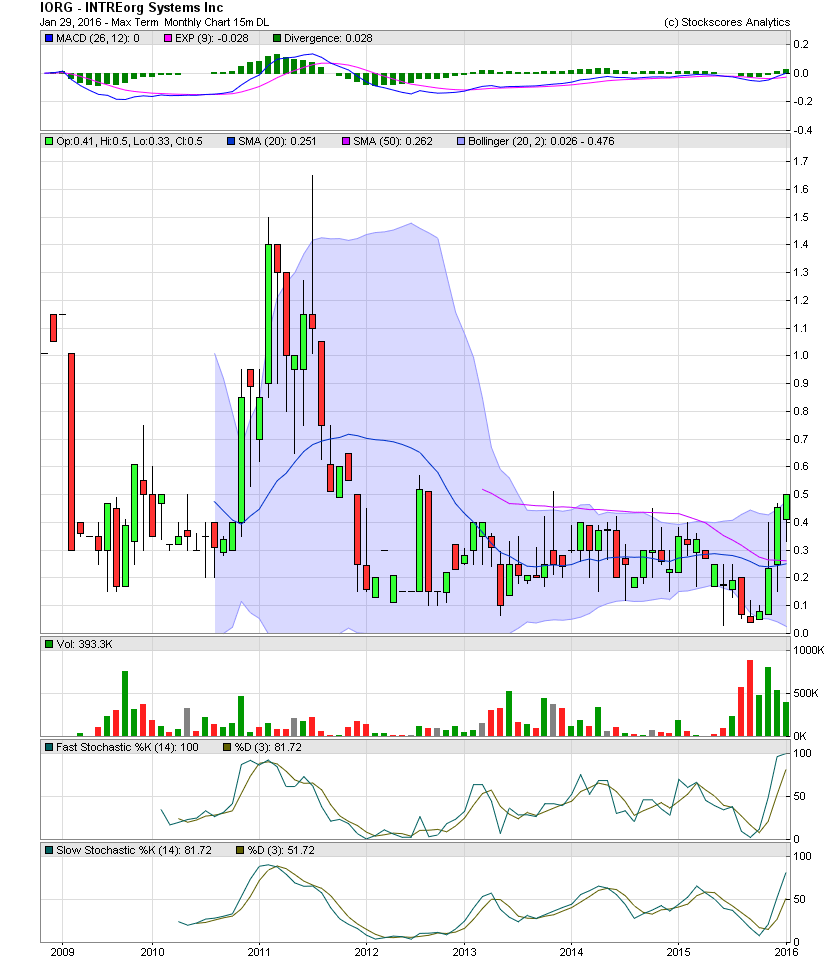
IORG Monthly Chart ~ A Seven Year View of Trading
As I mentioned in my previous post, IORG saw its highest close since mid 2012. In my opinion, a close over the .52 close and intraday high of .545 of 2012, would suggest the next resistance levels of the $1.00-$1.40 could be seen upon the first few material announcement that management is referencing. The share structure is very low with an OS of just 14.4MM. Although OTC Markets doesn't state a float, a brief call to the company suggests a float of approx 5.4MM. As one can see on the chart, IORG trades very thinly, so my opinion is that the stock is in very tight hands. GLTA

As I mentioned in my previous post, IORG saw its highest close since mid 2012. In my opinion, a close over the .52 close and intraday high of .545 of 2012, would suggest the next resistance levels of the $1.00-$1.40 could be seen upon the first few material announcement that management is referencing. The share structure is very low with an OS of just 14.4MM. Although OTC Markets doesn't state a float, a brief call to the company suggests a float of approx 5.4MM. As one can see on the chart, IORG trades very thinly, so my opinion is that the stock is in very tight hands. GLTA

