Posted On: 01/31/2016 11:50:16 AM
Post# of 2561

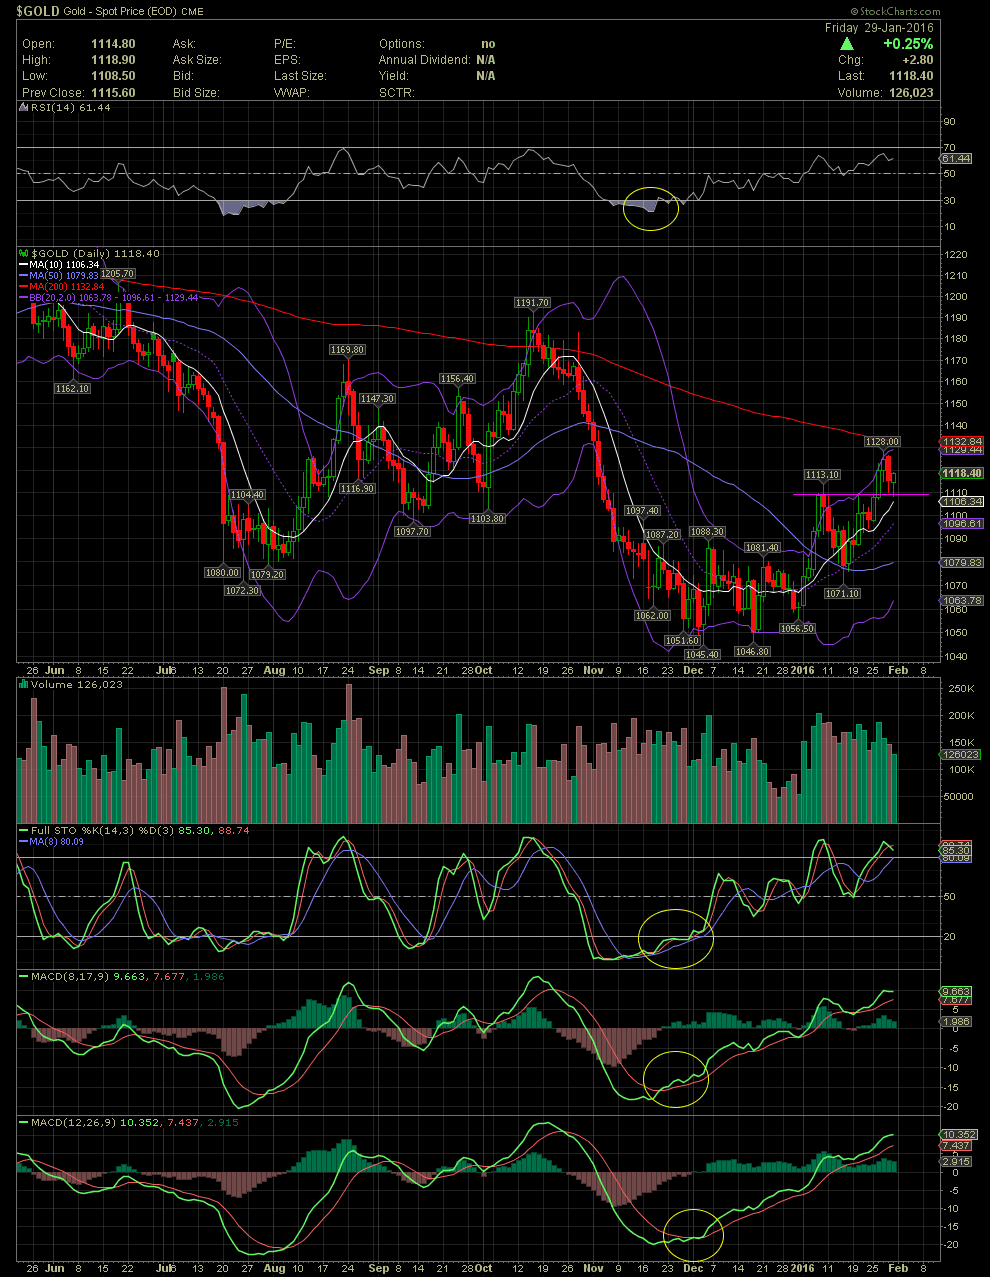
$GOLD Daily Chart ~ Moving Higher Since the December Lows
Spot Gold put in a bottom as suggested by the technical indicators of the FullSto and MACDs. As the price of gold began to base in the $1,045-$1,055 level, one can see the gradual rising of these indicators as gold was churning in that area. Since the upturn began, the price of gold ran outside the upper bollie on Jan 8-11. What's outside the bollies always returns to within the bollie. The retracement to inside the bands saw the MA50 offer support in the $1,070s before continuing hight to the current levels above $1,100. Many gold mining stocks made very sharp moves to the upside including a number of 3X gold miner ETFs, such as NUGT, which jumped from $17.40 to a high of $25.90 in one week. Currently, spot gold is finding some support at the $1,100 level after hitting $1,128 on Wednesday.
Spot Gold put in a bottom as suggested by the technical indicators of the FullSto and MACDs. As the price of gold began to base in the $1,045-$1,055 level, one can see the gradual rising of these indicators as gold was churning in that area. Since the upturn began, the price of gold ran outside the upper bollie on Jan 8-11. What's outside the bollies always returns to within the bollie. The retracement to inside the bands saw the MA50 offer support in the $1,070s before continuing hight to the current levels above $1,100. Many gold mining stocks made very sharp moves to the upside including a number of 3X gold miner ETFs, such as NUGT, which jumped from $17.40 to a high of $25.90 in one week. Currently, spot gold is finding some support at the $1,100 level after hitting $1,128 on Wednesday.