Posted On: 01/10/2016 1:26:40 PM
Post# of 2561

IORG Six Year Monthly Chart ~ Set Up for New Highs Since Our Entries
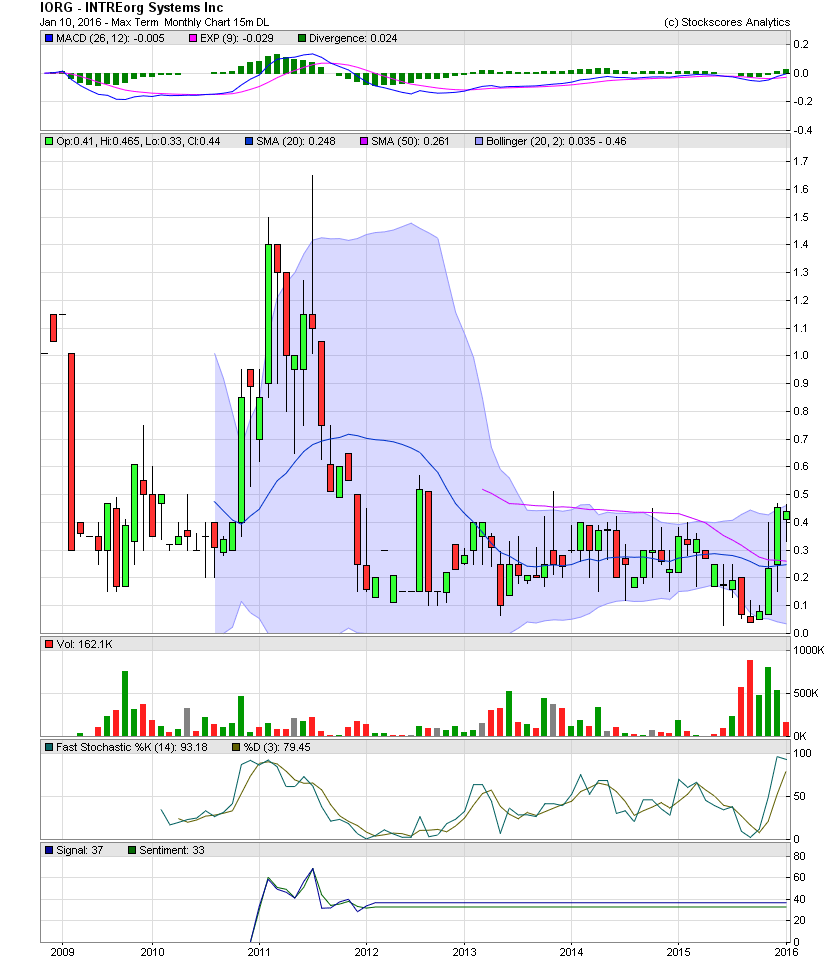
As one can see on the six year monthly chart below, IORG is sitting a new multi year highs at the .45/.46 level. In mid 2012, the stock closed in the low .50s. So a close and break above that level, could bring into play a test of the old highs in the $1.50s. Any significant material news and/or buying would easily drive the share price to levels not seen since 2011. I'll have a lot more to show should the stock begin to break into new levels. GLTA
As one can see on the six year monthly chart below, IORG is sitting a new multi year highs at the .45/.46 level. In mid 2012, the stock closed in the low .50s. So a close and break above that level, could bring into play a test of the old highs in the $1.50s. Any significant material news and/or buying would easily drive the share price to levels not seen since 2011. I'll have a lot more to show should the stock begin to break into new levels. GLTA