Posted On: 07/21/2015 5:03:59 PM
Post# of 75539
Chart analysis:
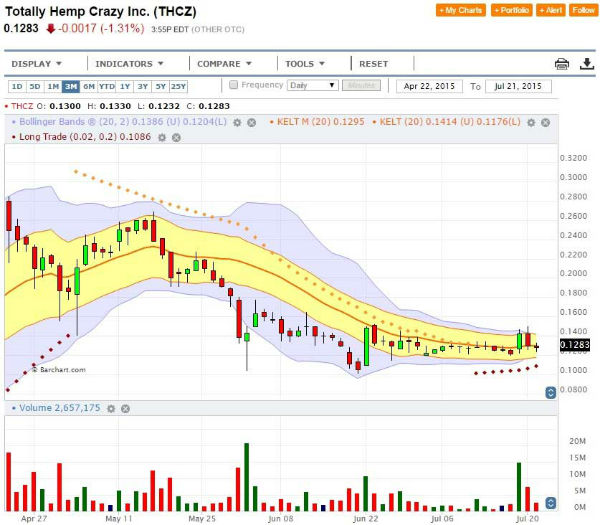
THCZ ended today with a doji red candle but charts still look favorable.
Parabolic SAR has moved under the price chart.
Bollinger Bands has been constricting and price is well within the middle.
Price has moved up to the middle range of the Keltner Channel.
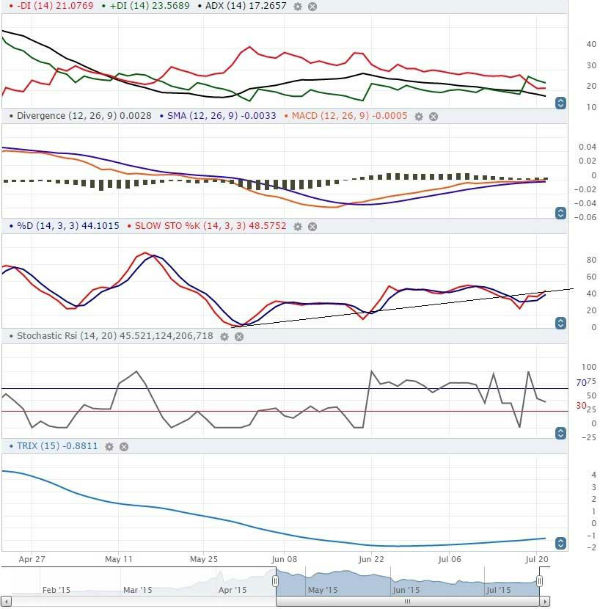
+D is above -D on the ADX chart.
MACD has just about crossed over the 0 line, hopefully this will signal an upward trend.
Slow Stochastic chart has shown an upward trend formation and the %K is above %D.
RSI is within reason.
The TRIX indicator is showing an upward reversal. TRIX usually lags behind the MACD.
The charts are starting to look good for a bullish (upward trend) reversal to happen soon.
I'll post my findings on the 10K within a few days when I get the chance. The ratios I found look good though. Keep in mind that 10K was really only based on 4 months! They just started production. Now the new year has started and THCZ is in full swing, I can't wait to see the new 10Q.
These are just my own opinion.
THCZ ended today with a doji red candle but charts still look favorable.
Parabolic SAR has moved under the price chart.
Bollinger Bands has been constricting and price is well within the middle.
Price has moved up to the middle range of the Keltner Channel.
+D is above -D on the ADX chart.
MACD has just about crossed over the 0 line, hopefully this will signal an upward trend.
Slow Stochastic chart has shown an upward trend formation and the %K is above %D.
RSI is within reason.
The TRIX indicator is showing an upward reversal. TRIX usually lags behind the MACD.
The charts are starting to look good for a bullish (upward trend) reversal to happen soon.
I'll post my findings on the 10K within a few days when I get the chance. The ratios I found look good though. Keep in mind that 10K was really only based on 4 months! They just started production. Now the new year has started and THCZ is in full swing, I can't wait to see the new 10Q.
These are just my own opinion.