TRX ~ End of the Week Chart
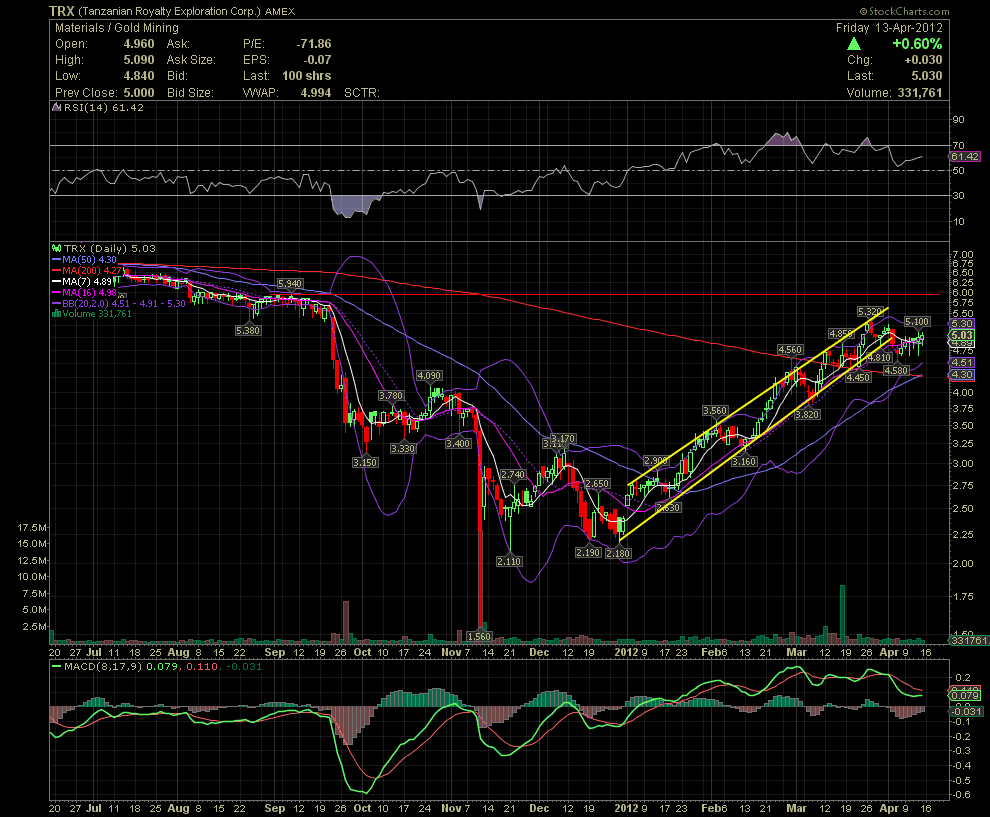
My friends and I entered TRX at the mid- Dec/early Jan when the stock was trading at the 2.20-2.50 level. Please note the strong uptrend which was briefly broken two weeks ago. A few of us traded the channel which I've marked in yellow. This was about as easy as it gets with the stock finding support (buy level) at the lower ends of the channel and the resistance (sell points) at the upper ends. The correction during the last top at 5.32 saw a drop to as low as 4.58 as we awaited a reset of the chart. After trading sideways in the 4.60s to 4.80, those swing trading chose to reenter before we saw the daily chart giving a buy signal. Those familiar with charting obviously are using short term charts, such as the 5, 10, 15, 30 and 60 minutes, while searching for an entry or an exit. I think we are good to go as Jim Sinclair takes his company a lot higher for patient shareholders.
So with TRX, so far so good on our latest reentry. Those holding TRX without swing trading will also do very well as I expect TRX to move sharply higher over the next 1-3 years.