Posted On: 11/23/2014 11:06:59 AM
Post# of 2561

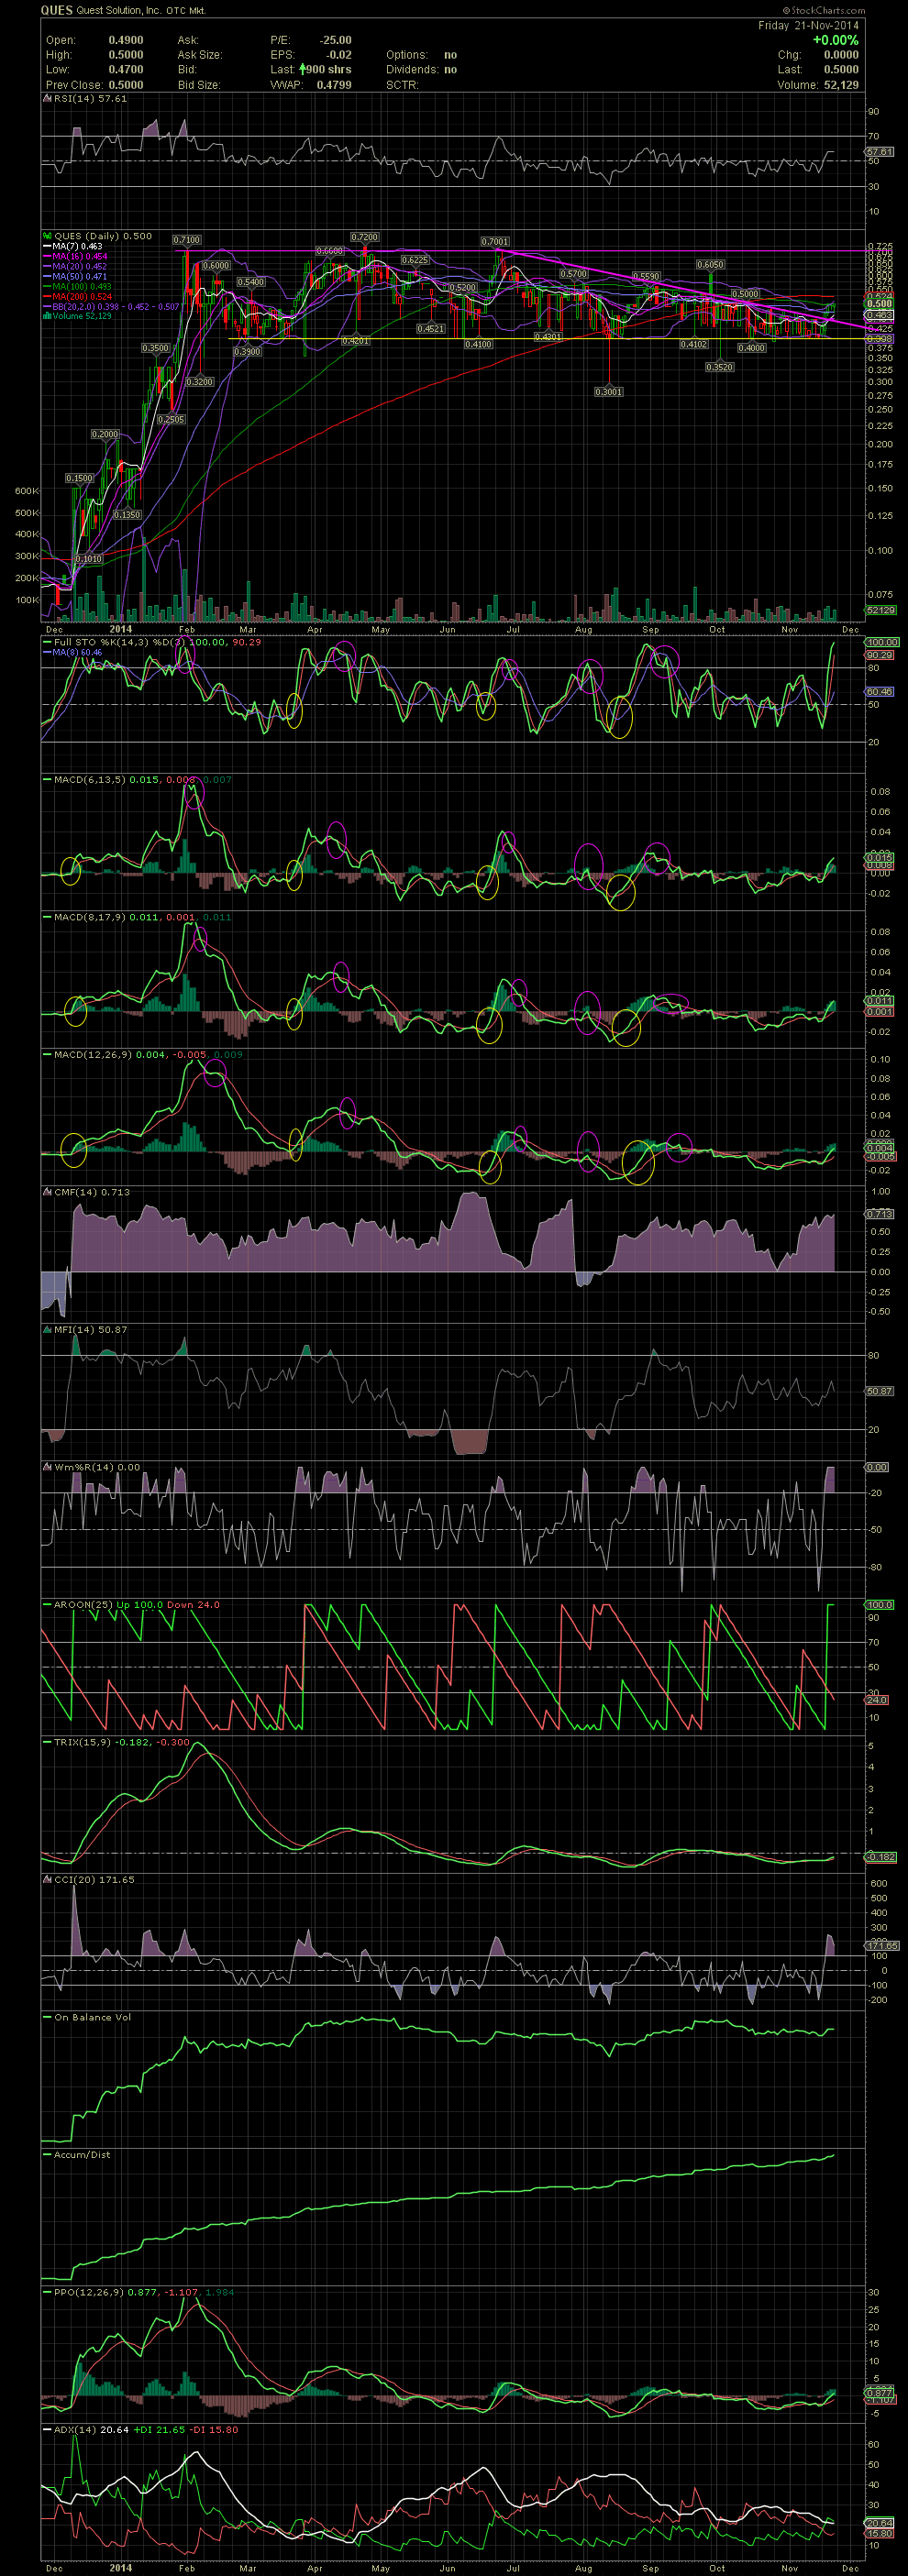
QUES Daily Chart ~ Nine Months of Consolidation Coming to an End
I am going to post three charts on QUES with a few thoughts as to what I see on a technical/chart basis.
The chart below is one year, daily chart showing the initial move from under .08 and the move to .71 in late January. Since that time, the stock has channeled between the .40s to .70s for almost nine months. The high in August has witnessed a declining tops line into mid November when the stock finally broke above that line and has held above it for three consecutive days. A break move and close above .50 and then .56 will signal a new leg to the upside has started. GLTA