Posted On: 10/29/2014 5:49:11 PM
Post# of 123

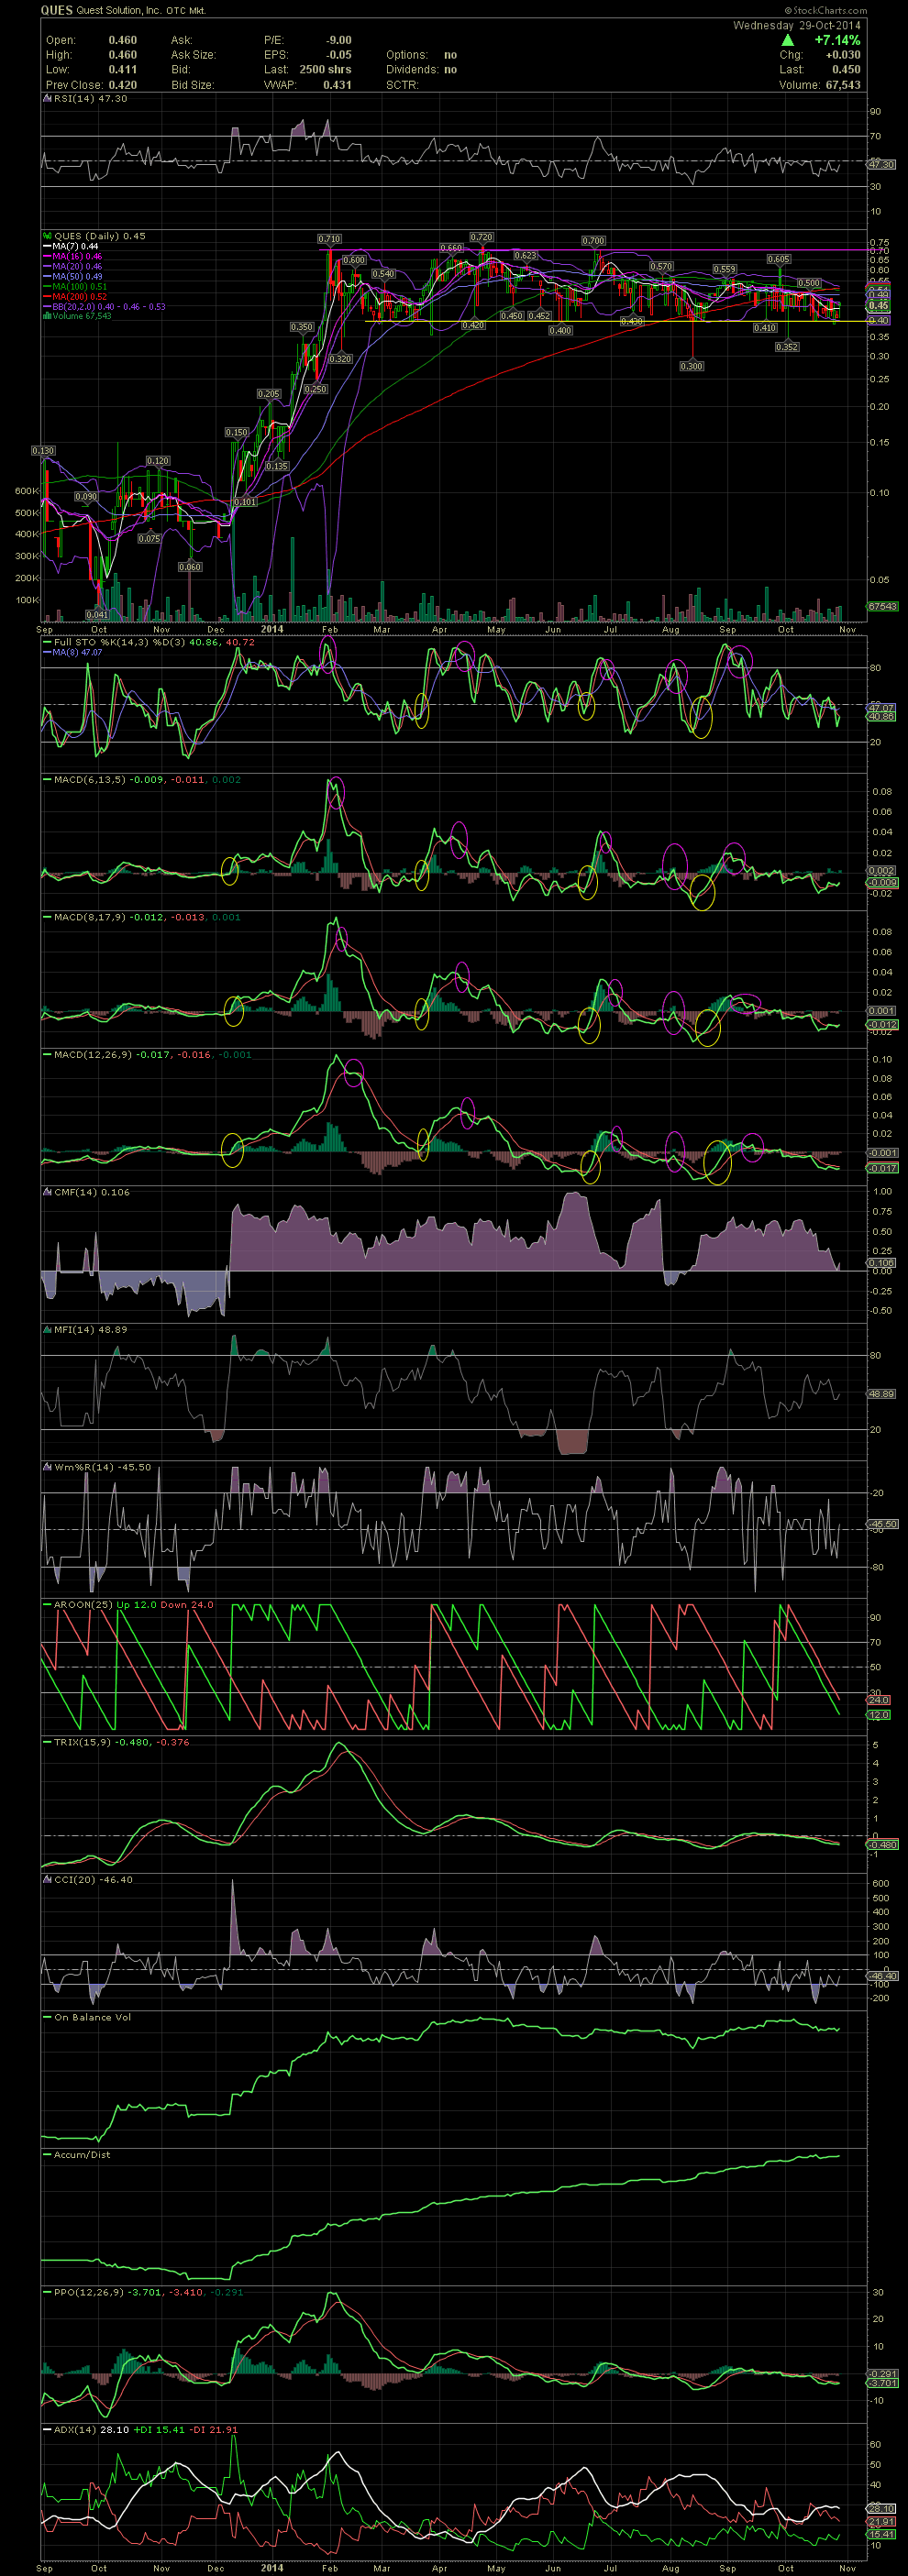
QUES Daily Chart ~ Holding Well During the OTC Bear Market
As one can see on the chart below, there has been tremendous support at the .40 level after the stock ran from a low of .04 to a high of .72. During the channeling on the chart, the OTC stocks have seen one of the worst bear markets that I've ever seen. Can't complain about a stock that has held a 1000% return since its move while the rest of the OTC has collapsed.
Looking at the chart, I'm beginning to see a setup for a move to new highs. Keep an eye on the FullSto, MACDs and a break above 50 on the RSI. My guess is once the 10Q is out, QUES will probably begin a move to the $1.50 level before the year is up. Next year I'm hoping for $5+. In the meantime, the accumulation period of sub .50s is running out of time. GLTA