Posted On: 09/30/2014 11:29:37 PM
Post# of 2561

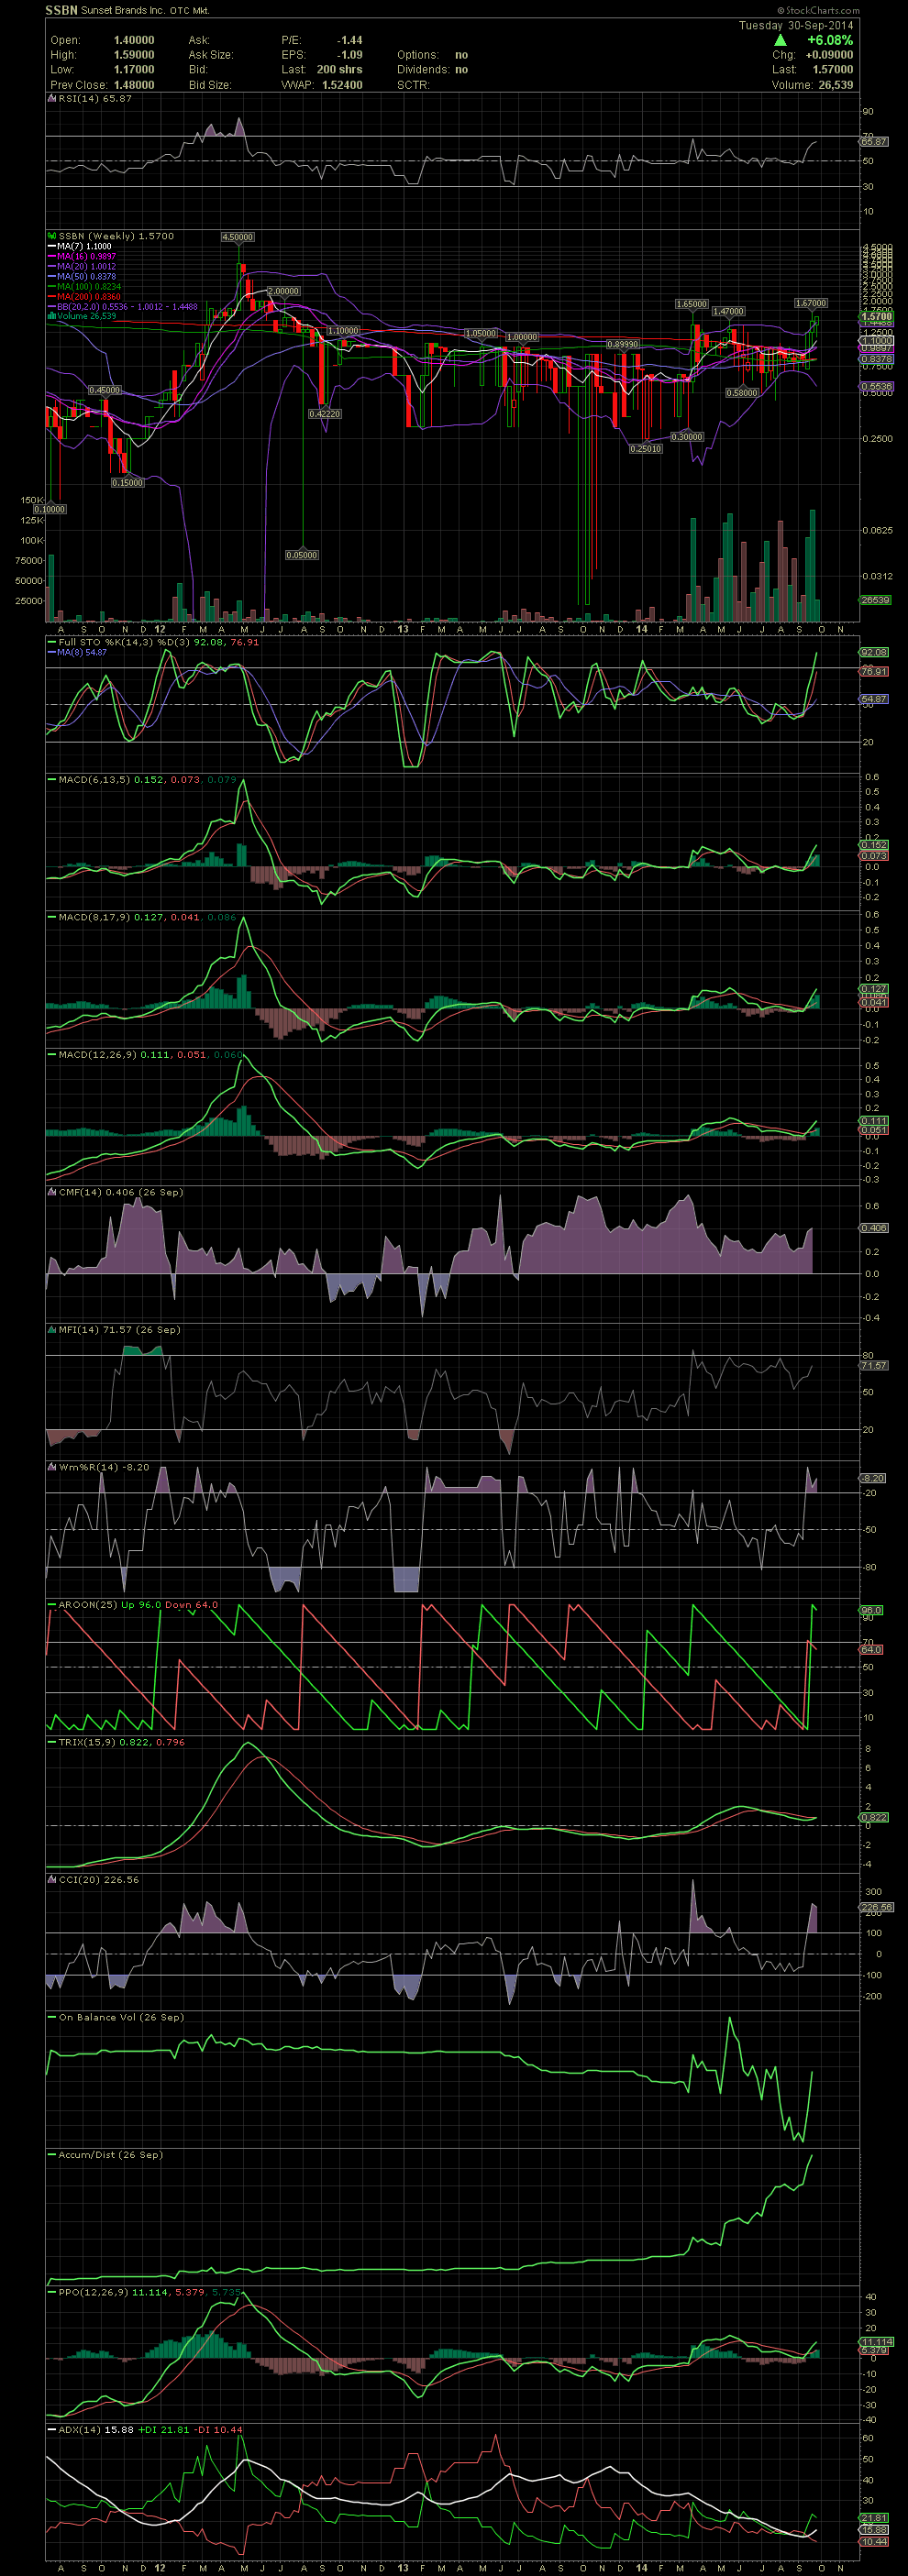
SSBN Weekly Chart ~ Breaking to New Multi Year Highs
This chart tells the story of strong accumulation since early in the year. As investors await the audited financials and news, the accumulation of this low float, low OS security continues as can easily be seen on the chart. Last week, as I mentioned on my post of the SSBN Daily Chart, saw a new multi year high of 1.67. At the close today, it looked like less than 2,000 shares on L2 asks could have taken the stock well over $2.00. Obviously, there will always be a few open orders that can't be seen on L2 until lower asks have been taken out. But she's looking very, very thin. GLTA
This chart tells the story of strong accumulation since early in the year. As investors await the audited financials and news, the accumulation of this low float, low OS security continues as can easily be seen on the chart. Last week, as I mentioned on my post of the SSBN Daily Chart, saw a new multi year high of 1.67. At the close today, it looked like less than 2,000 shares on L2 asks could have taken the stock well over $2.00. Obviously, there will always be a few open orders that can't be seen on L2 until lower asks have been taken out. But she's looking very, very thin. GLTA