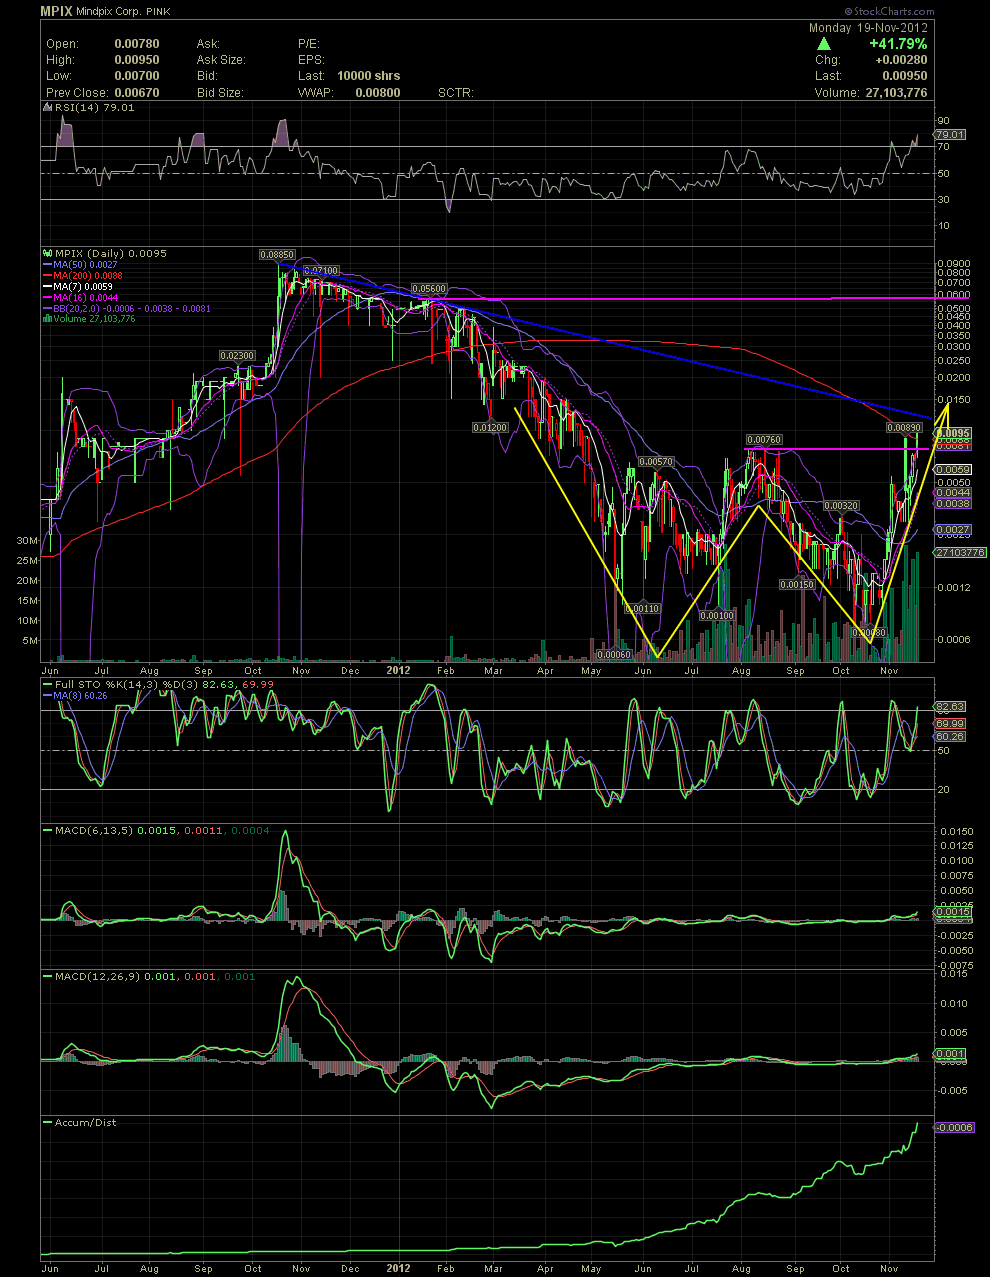
MPIX 18 Month Daily Chart...............
Once again, please link back to previous charts regarding the 'W Formation' that I've been posting on. As I had hoped for in early posts, a move and close up and over the middle portion (lower pink line) of the 'W' would be a strong indication that the MA200 would be tested. I didn't know it would happen this quickly, but I'm sure most of you aren't too upset about that event. It will now be important to hold the MA200, with volume, even if it's only a sideways consolidation. The next point of resistance as I see things would be the declining tops line (blue) that is currently cutting downwards at approx .0122. My thoughts of yesterday remain the same as to a break over the blue declining tops line would suggest a move to the .056 horizontal resistance line (upper pink line) and eventually the highs .0885. GLTA

