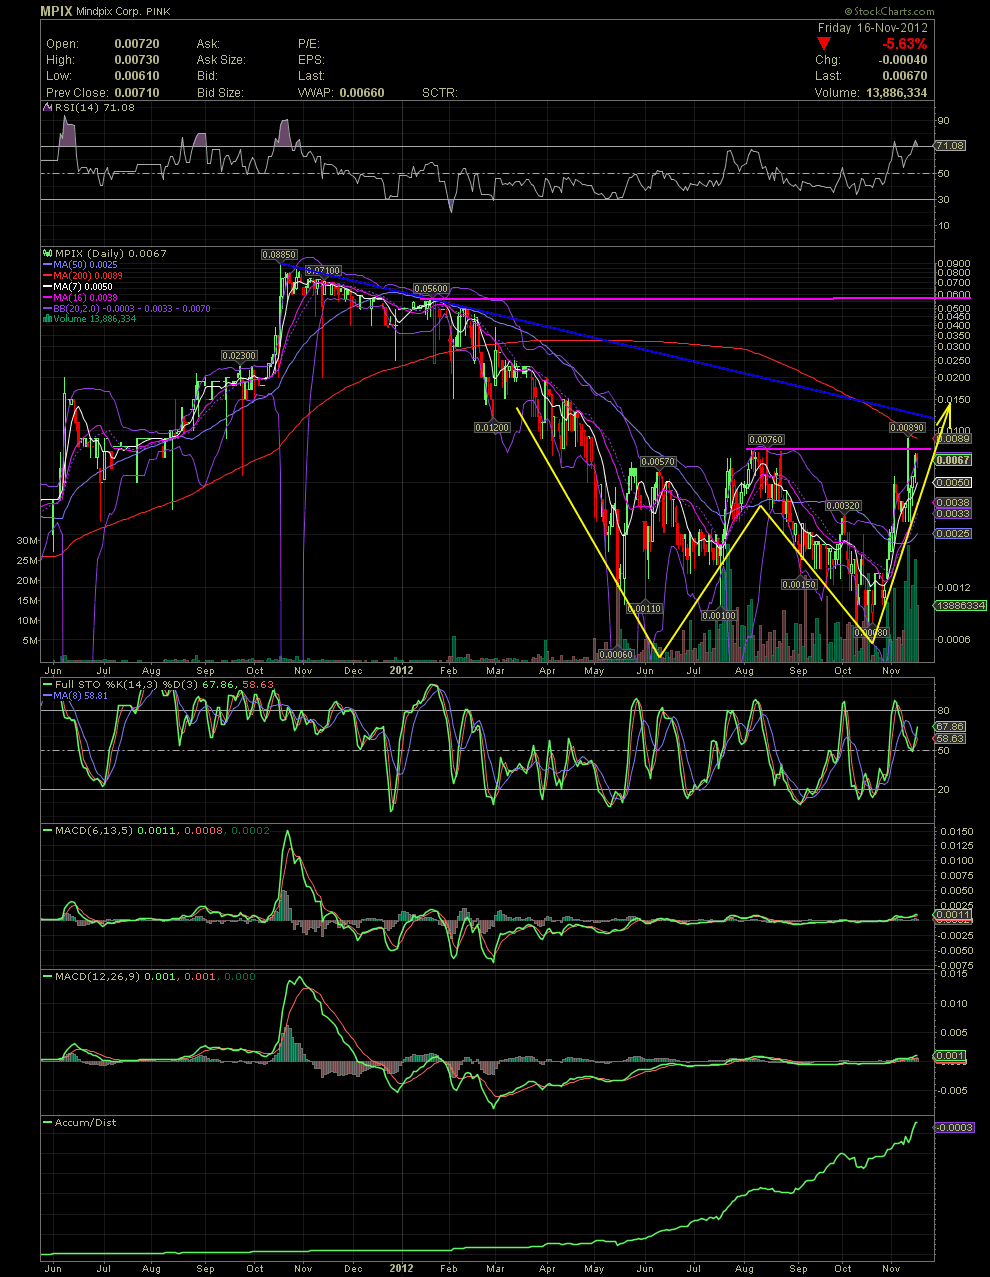
MPIX 18 Month Daily Chart........ A Longer Term View of a HUGE 'W' Formation
Ok, there's a lot to see in this chart. You already have the shorter term targets (see my previous Daily Chart post). What should be seen here, even by Stevie Wonder, is an 8-9 month 'W' Formation which began months ago. It's in yellow, lol. With the longer term view here, one can see last year's high of .0885 and where we are now. Again, immediately ahead is the MA200 (red) at .0089. We also have the long term declining tops line (blue) crossing at approximately .0123. More importantly on the short term would be that close at or over .0077 which would signify a breakout above the middle portion of the 'W'. When these three levels are taken out, with volume, I think MPIX could see a very swift move to the .056 horizontal resistance target (pink). And it should be clear that a move over the 2011 high of .0885 would be a clear Blue Sky breakout. Finally, please note the A/D line and the volume bars over the last few months. Something big is on the horizon, and I hope today's early morning PR is the start of months of news. GLTA