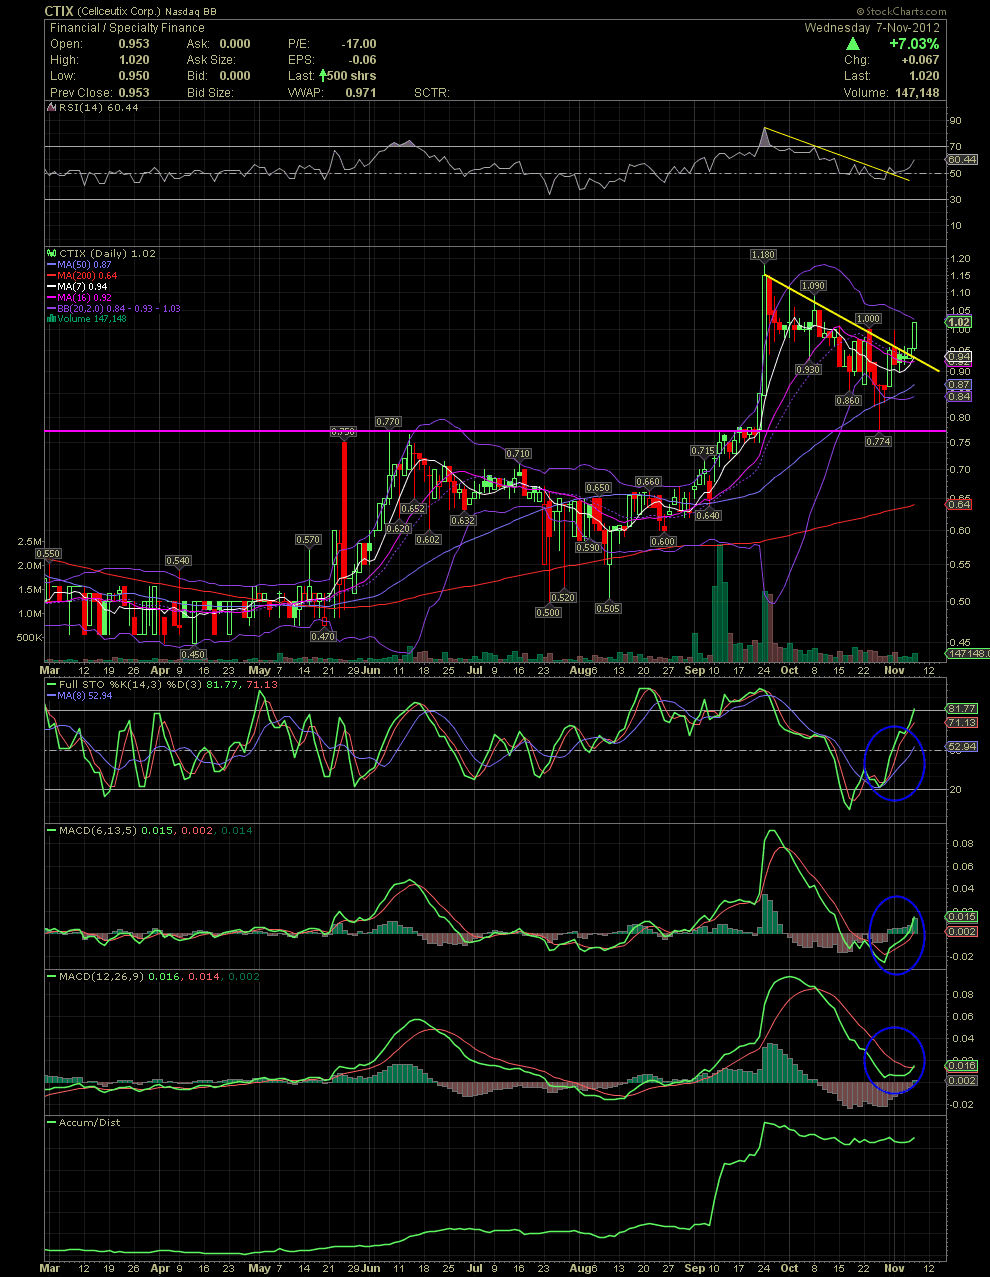
CTIX Daily Chart...... Great Day Over Here Today!
Hello everyone. Here's the updated CTIX Daily Chart as of today's close. Lot's to talk about but mainly the same indicators that are now screaming buy. Obviously you can all the the declining tops line (yellow) which we broke above today. One could have made a minor case of that late yesterday, but the confirmation with today's candle proved it. The faster indicators, FullSto and faster MACD, had already given buy signals which I shared here over the last couple of days. Today the longer term MACD is just starting to crossover for an additional sign of support. The RSI broke above its declining tops line yesterday, and now it's on it's way towards the power zone of 70+. A couple of other confirmations occurred today to include the MA7 crossing up and over the MA16. The MAs are all in nice shape with the shorter term MAs rising up and over the longer term MAs, 7 above the 16 which is above the 50 and those are above the 200. The only small problem is that the stock price in going to run into the upper bollie tomorrow. As long as the candle doesn't violate it upper bollie by too much (typically more than half the candle outside the UB), everything will be fine. Check back to Sept 24, and you can see what I mean with the move of the candles up and outside the upper bollie at the time. What moves outside the bollie bands, always comes back in. The inverse is also true when a candles gets too far outside the lower bollie as you can see in late July/early Aug then again two weeks ago when the share price dropped to .74.
Technicals are great tools to compliment ones fundamental research. As I've mentioned, you can definitely stack the odds in your favor. One thing to remember, NEWS always trumps the technicals.
Congrats on the nice move today! Have a great evening.

