Investors Hangout Stock Message Boards Logo
  • Home
  • Mailbox
  • Boards
  • Favorites
  • Whats Hot!
  • Login - Join Now!
Spectacular Solar Inc. SPSO
Posted On: 11/06/2012 1:45:52 AM
Post# of 64
Avatar
Posted By: Big Tuna

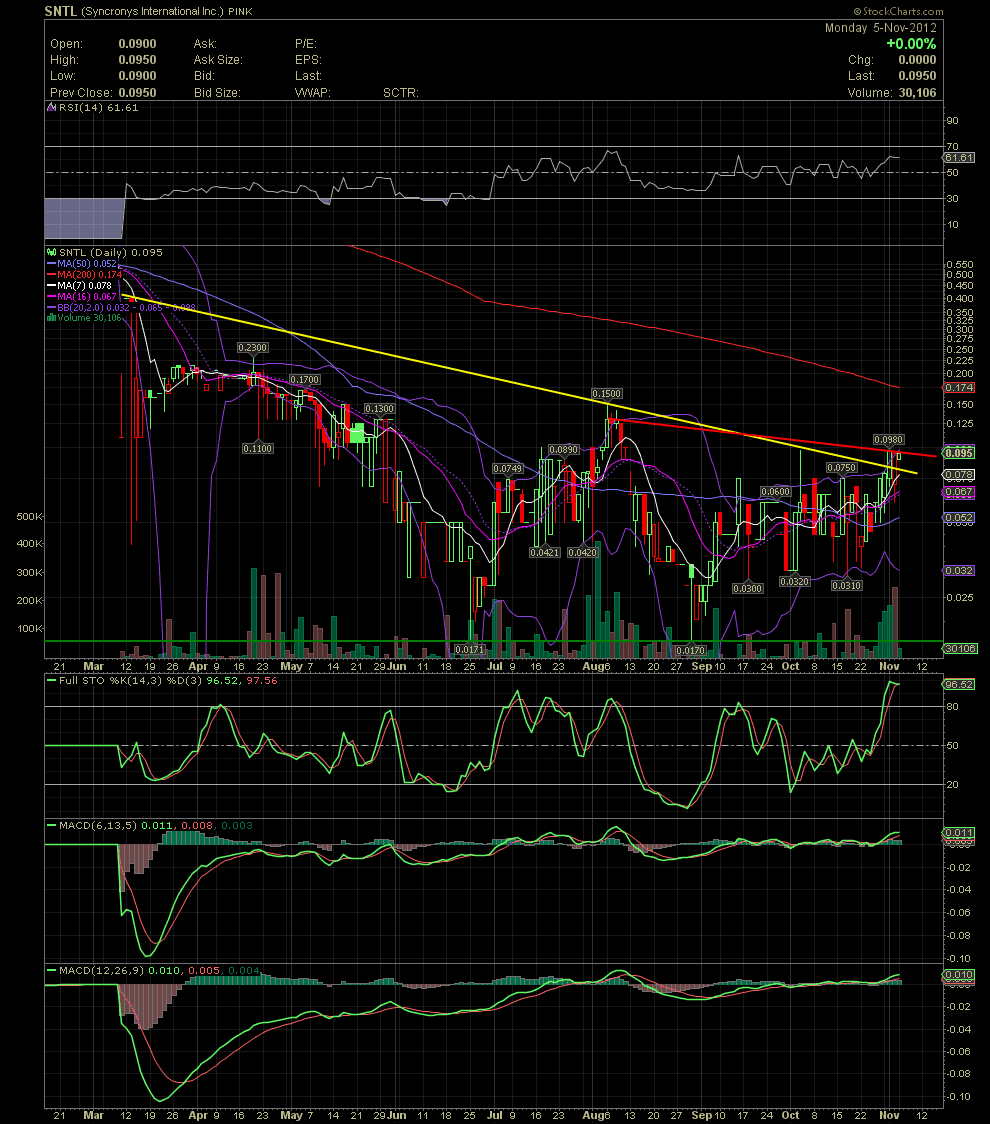
SNTL Daily Chart..... Not Sure Why No One Is Posting About This Beauty!


SNTL is one good looking chart. A few of us have been accumulating to as low as .028 and into the .11 area over the last few weeks. We are hoping to see .25-.50 this year still should all go well. As you can see on the chart below, SNTL is about to break out to the upside over the short term declining tops line (red) after getting thru the longer term downtrend (yellow). The recent tops in the high .09s over the last three days appear to be falling. The next point of resistance would be the .14/.15 level which was seen in early August and the MA200 at .174 next.


(0)
(0)


  • New Post - Investors HangoutNew Post

  • Public Reply - Investors HangoutPublic Reply

  • Private Reply - Investors HangoutPrivate Reply

  • Board - Investors HangoutBoard

  • More - Investors HangoutMore

  • Keep Post - Investors HangoutKeep Post
  • Report Post - Investors HangoutReport Post
  • Home - Investors HangoutHome
  • Mailbox - Investors HangoutMailbox
  • Boards - Investors HangoutBoards
  • Favorites - Investors HangoutFavorites
  • Whats Hot! - Investors HangoutWhats Hot!
  • Settings - Investors HangoutSettings
  • Login - Investors HangoutLogin
  • Live Site - Investors HangoutLive Site