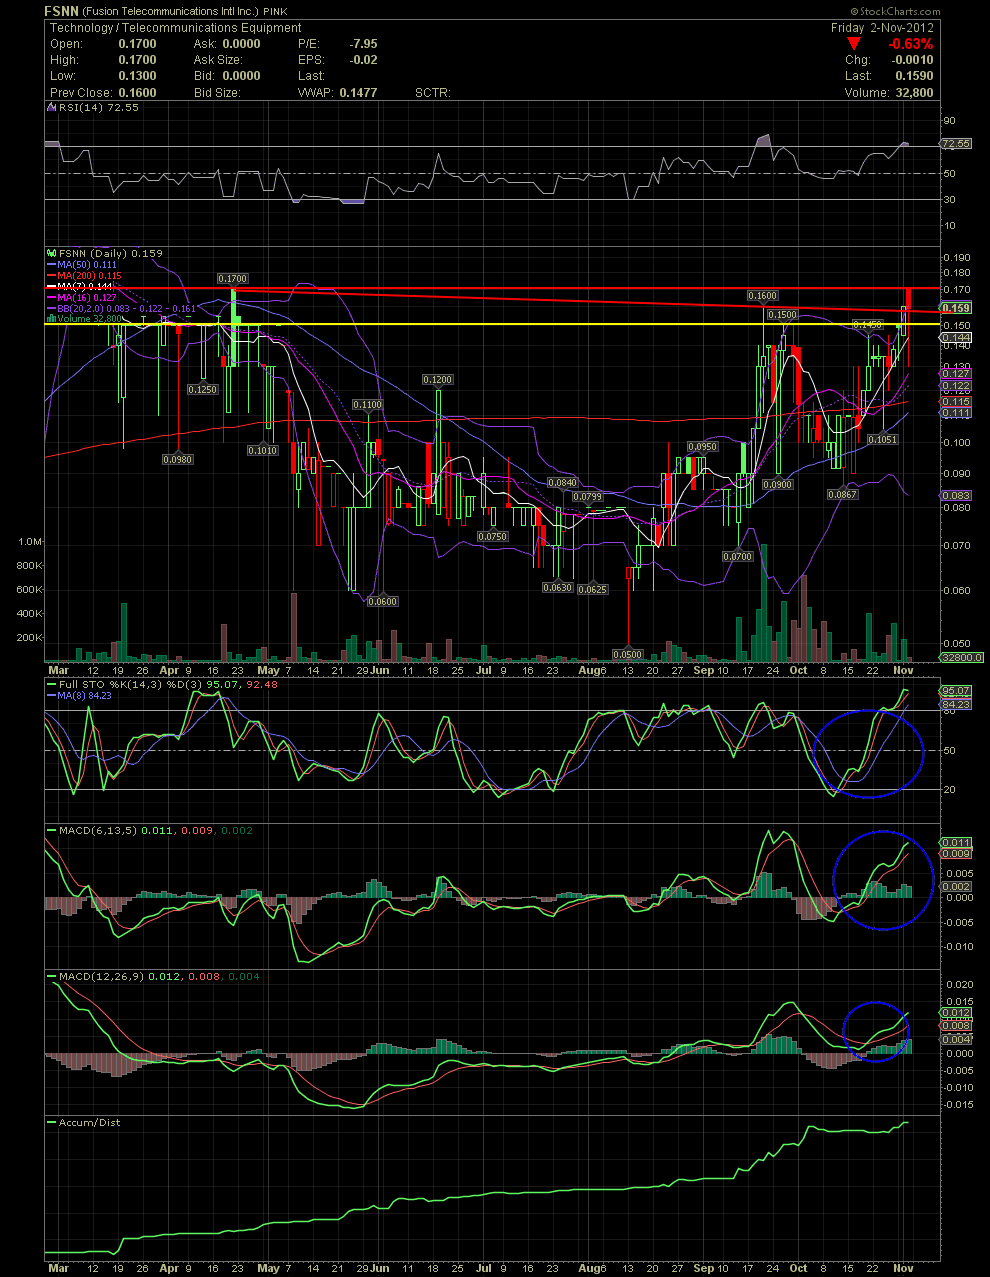
FSNN Daily Chart...... Yo Yo Yo! What's Up FSNNers!! What a great Friday we witnessed as to NEWS!
We saw an opening buy at .17 on Friday by a friend of mine. I didn't know he was going to buy, otherwise I would have suggested he enter an order in the .15s. I don't blame my friend,
though, because if I had more money, I'd add at the ask also to get more SHARS!! I need more SHARS!! I'm as excited as he is to own FSNN. That started the day at .17, and since
there was no follow thru buys at the ask, we saw the beginning of a solid red candle, as most others investors chose to bid sit and wait for the impatient to sell to them.
As to the chart, it's easy to see our double top at .17 now. The pullback to the .13 level was followed by a move back above the declining tops line which is sitting at approx
.157. Most of the indicators on the chart are a little overbought now due to the two week move from .087 in mid October to Friday's high of .17. As news and the work of the
IR company begins to evolve, I believe we'll see a steady move over the next few weeks and months to well over the dollar level. In my opinion only, I would use any dips as
opportunities to add to ones position. This is going to be FUN! GLTA

