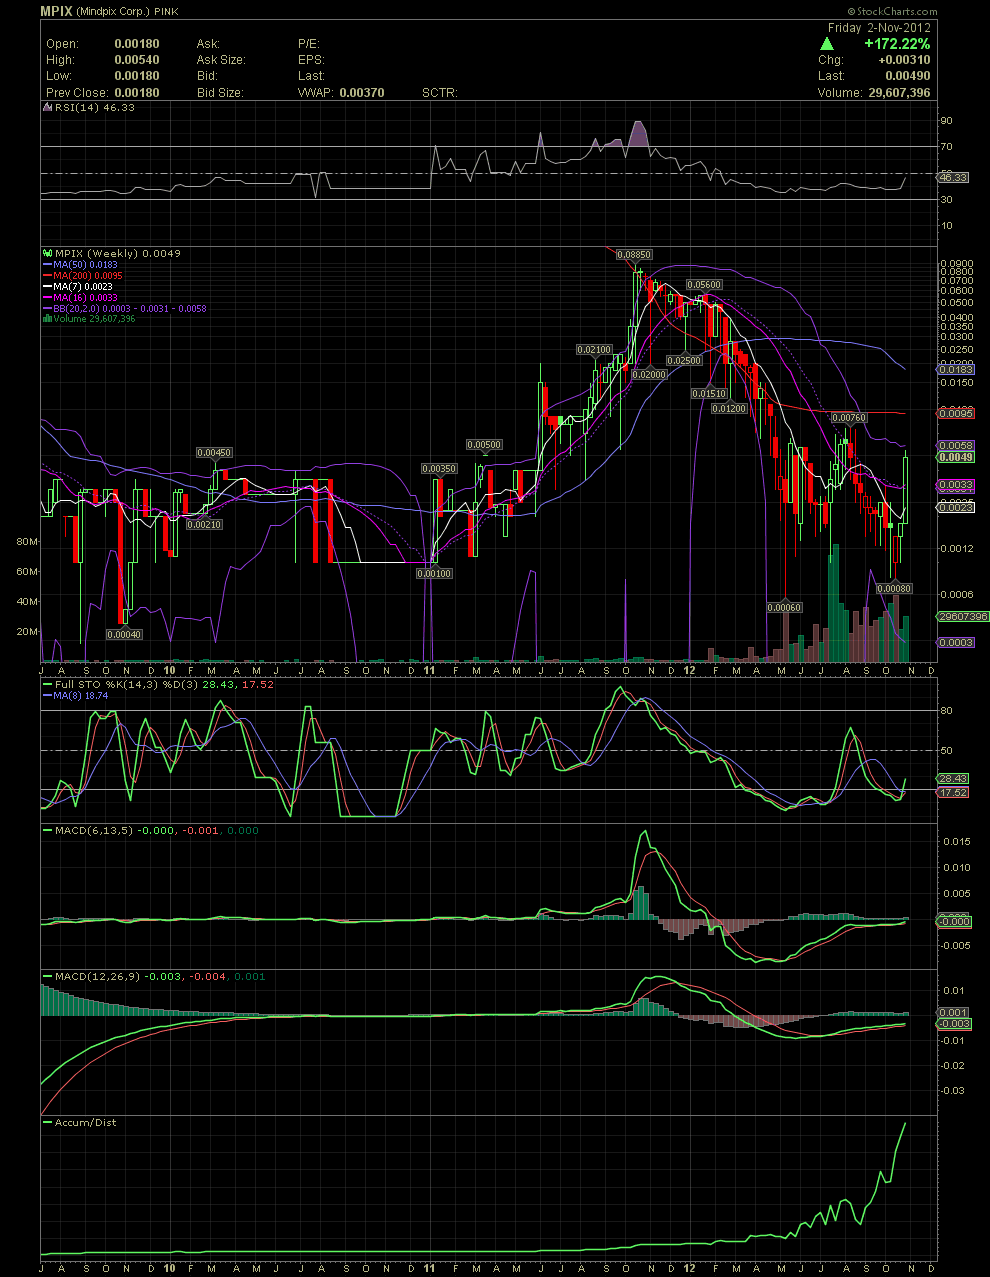
MPIX Weekly Chart ~ Up 88.7% for today and up 172.2% for this Three Day Trading Week
Here's a look at the weekly chart which clearly shows a 'W' bottom formation. Many tech traders will enter only once the right side of the 'W' breaks out above the center of the pattern. In this case, that would be at the .0076 area. No thanks! That would have been way too long for me and friends to enter. Plus, we have been taking the risk of accumulating for quite some time now. On a weekly chart, one of my favorite indicators is the FullSto. You can see how it's once again moved to a buy signal. The TRIX, although a slower indicator, is also a good one, and it is just about ready to cross to the upside. This could be a multi month move imo. So good luck to all shareholders. Have a great weekend!

