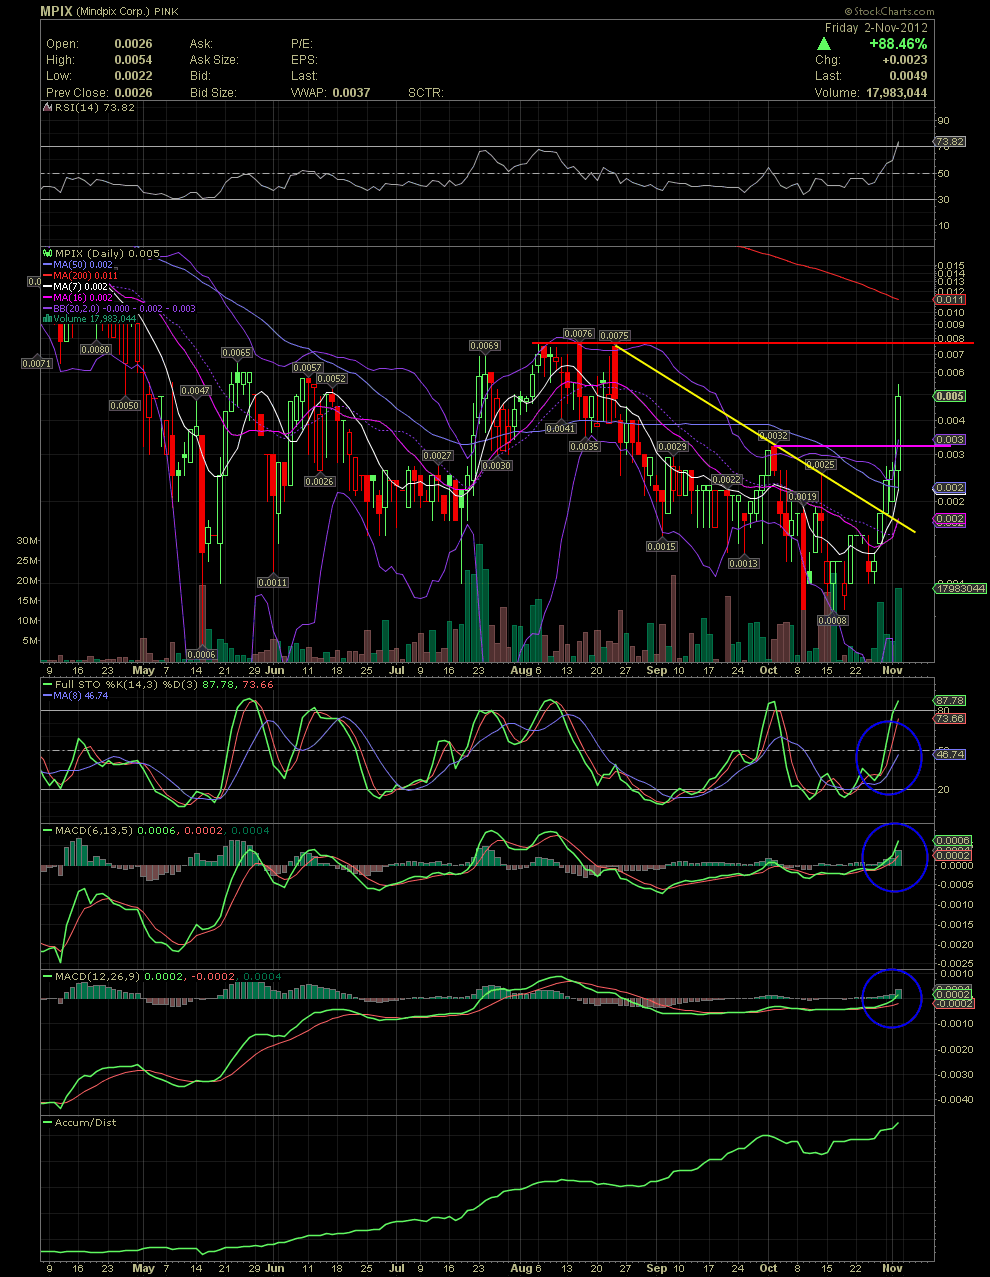
MPIX Daily Chart ~ Hmmm, you are looking for .03 next week? I'd be happy to see .01 at the end of next week!
For all the honest MPIX shareholders, now you can see why I've been sharing the technicals here for weeks. There's never a guarantee of success, but using charts as a tool to show money flow, price trends, etc., can really help one's overall returns. Many have been accumulating here for a few months now while waiting for the company to execute their business plan. I'm still waiting for any news, but in the meantime I have mentioned often, as did Coolnapz when he shared his technical thoughts, what to watch for. Last week I suggested that the stock had to recapture a few of the moving averages that were lost when the stock fell below then in October. Additionally, very nasty and vicious message board attacks occurred at a very scummy site, which, imo, assisted in scary a lot of shareholders who probably sold in a panic while the typical bashing asswipes worked those boards. The result was a stock price that collapsed as many longer term shareholders just backed off and accumulated shares on the lowered bids from the sellers. What I hope is that any of those scumbags sold all their shares also, along with the individuals they hurt, and were not able to re-enter at lower levels. That's another tactic that these creeps do, bash and buy. Then pump and dump. Not sure what their issues are, but to spend months on stock boards, bashing with every post 24/7, I can assure you that they aren't there to assist you.
Enough with those clowns and on the chart now. As you can see, the stock established a double bottom at the .0008/.001 level in Oct after months of declines. There selling really dried up on Oct 24 when the volume for the entire day fell to 309k shares. As I mentioned previously, the stock only closed below .001 on one day. That was a strong indication that the worse was over. On Oct 26 the share price moved back above the MA7 and 16. I said it would be a good thing if the price could move over the MA20 aka the middle bollie, which was trading at approx .0014. Once the stock regained the MA20, the next target of resistance I saw was the MA50 at just over .002. That was barely accomplished this Wed. I also note that a close at or above .0032, the previous high in early Oct, would be a strong indication that the stock was going to mark a sharp move to the upside. Now that we've seen this all happen, I think the next areas of resistance will be that area just above today's close which is grouped from .0069 to .0076 which was established in the July/August period. After that level is broken, it should bring into play a move into the .01-.02 area. The various other indicators can be seen as in strong buy signals such as the MACD and FullSto. The A/D line continues to show heavy accumulation since early May, and the RSI has now moved into slightly overbought levels.
Once again, congratulations to all of you who might have been following along and continued accumulating or entered in the .000s and low .00s. Patience and nerves of steel are needed with pennies. Those who know what to look for, while avoided those that aren't posting on other site for your benefit, can do extremely well over time. And THAT'S what Investors Hangout is all about. Honest and hard working investors helping each other! Congrats!


