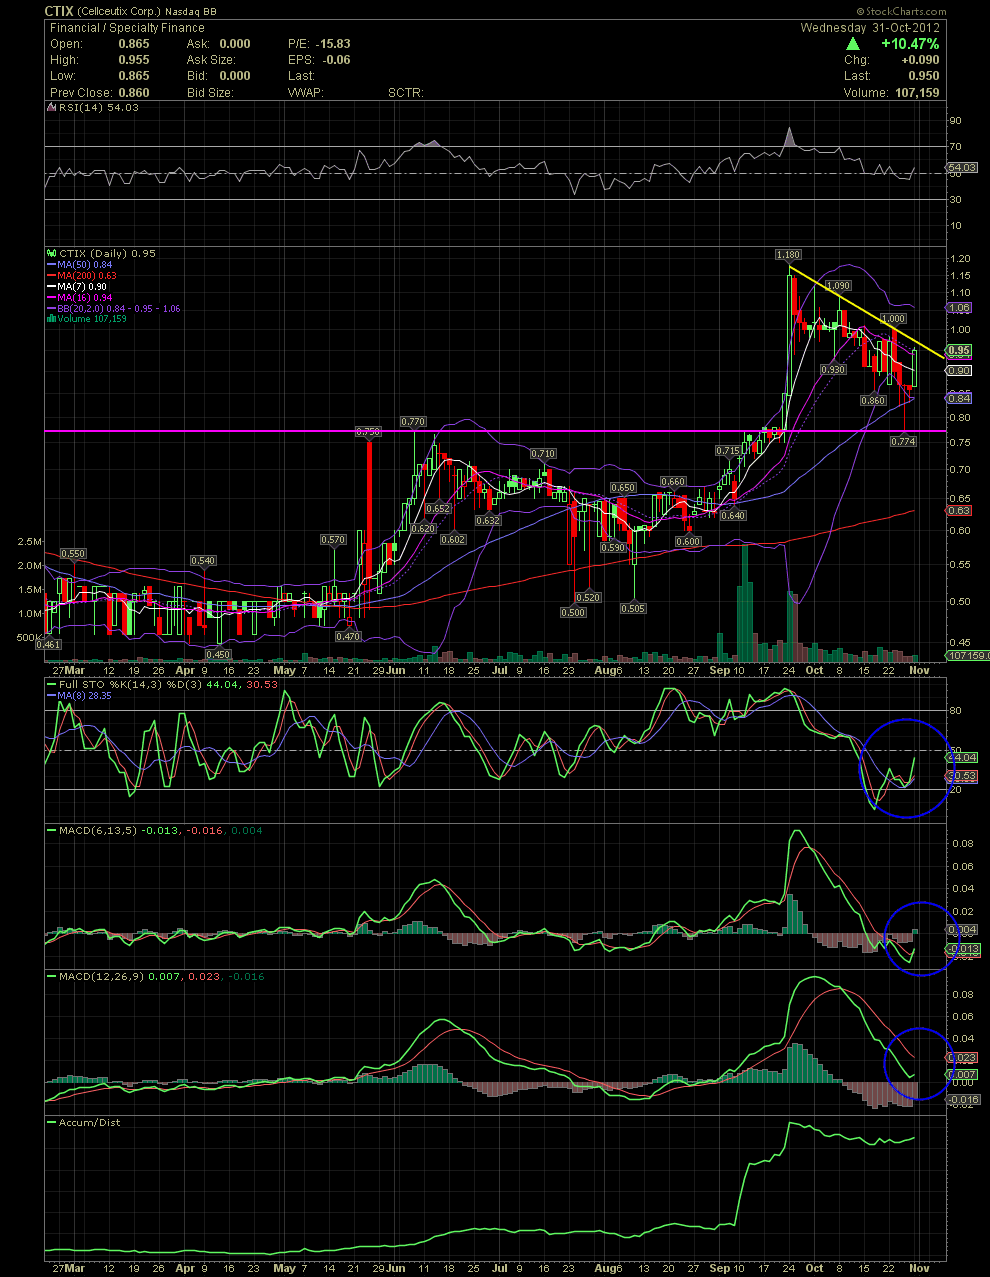
CTIX Daily Chart.........
Good Morning Everyone! A nice rebound yesterday for CTIX. The importance of yesterday's sharp reversal is that a few of the moving averages have been recaptured by the stock price. The stock moved up and over the shorter term MAs, such as the 7, 10 and 16. Of more importance to many TA guys, is that the share price closed exactly on the MA20, aka the middle bollie band. It's the dotted line on the chart below. Note what happens to the share price when it breaks above the 20 vs when it falls below. That's a big one to follow for many traders. As I mentioned yesterday, the FullSto and MACDs are looking good with two of three giving a buy signal yesterday. The longer term RSI is back over 50 and hopefully heading over 70. The A/D line shows that accumulation has started again a few days ago. The multi week decline appears to have held the support levels of previous highs seen in May, June and Sept at the .74-.78 level. That intraday drop on Thursday was almost a no brainer for those following the technicals. Had it not held, I would have looked for support at the MA200 or the area of consolidation in the low .60s of August. While many consider charting mumbo jumbo, technical analysis is a great tool to compliment one's fundamental analysis, and I would suggest using it. GLTA

