Posted On: 07/09/2014 11:01:34 PM
Post# of 2561

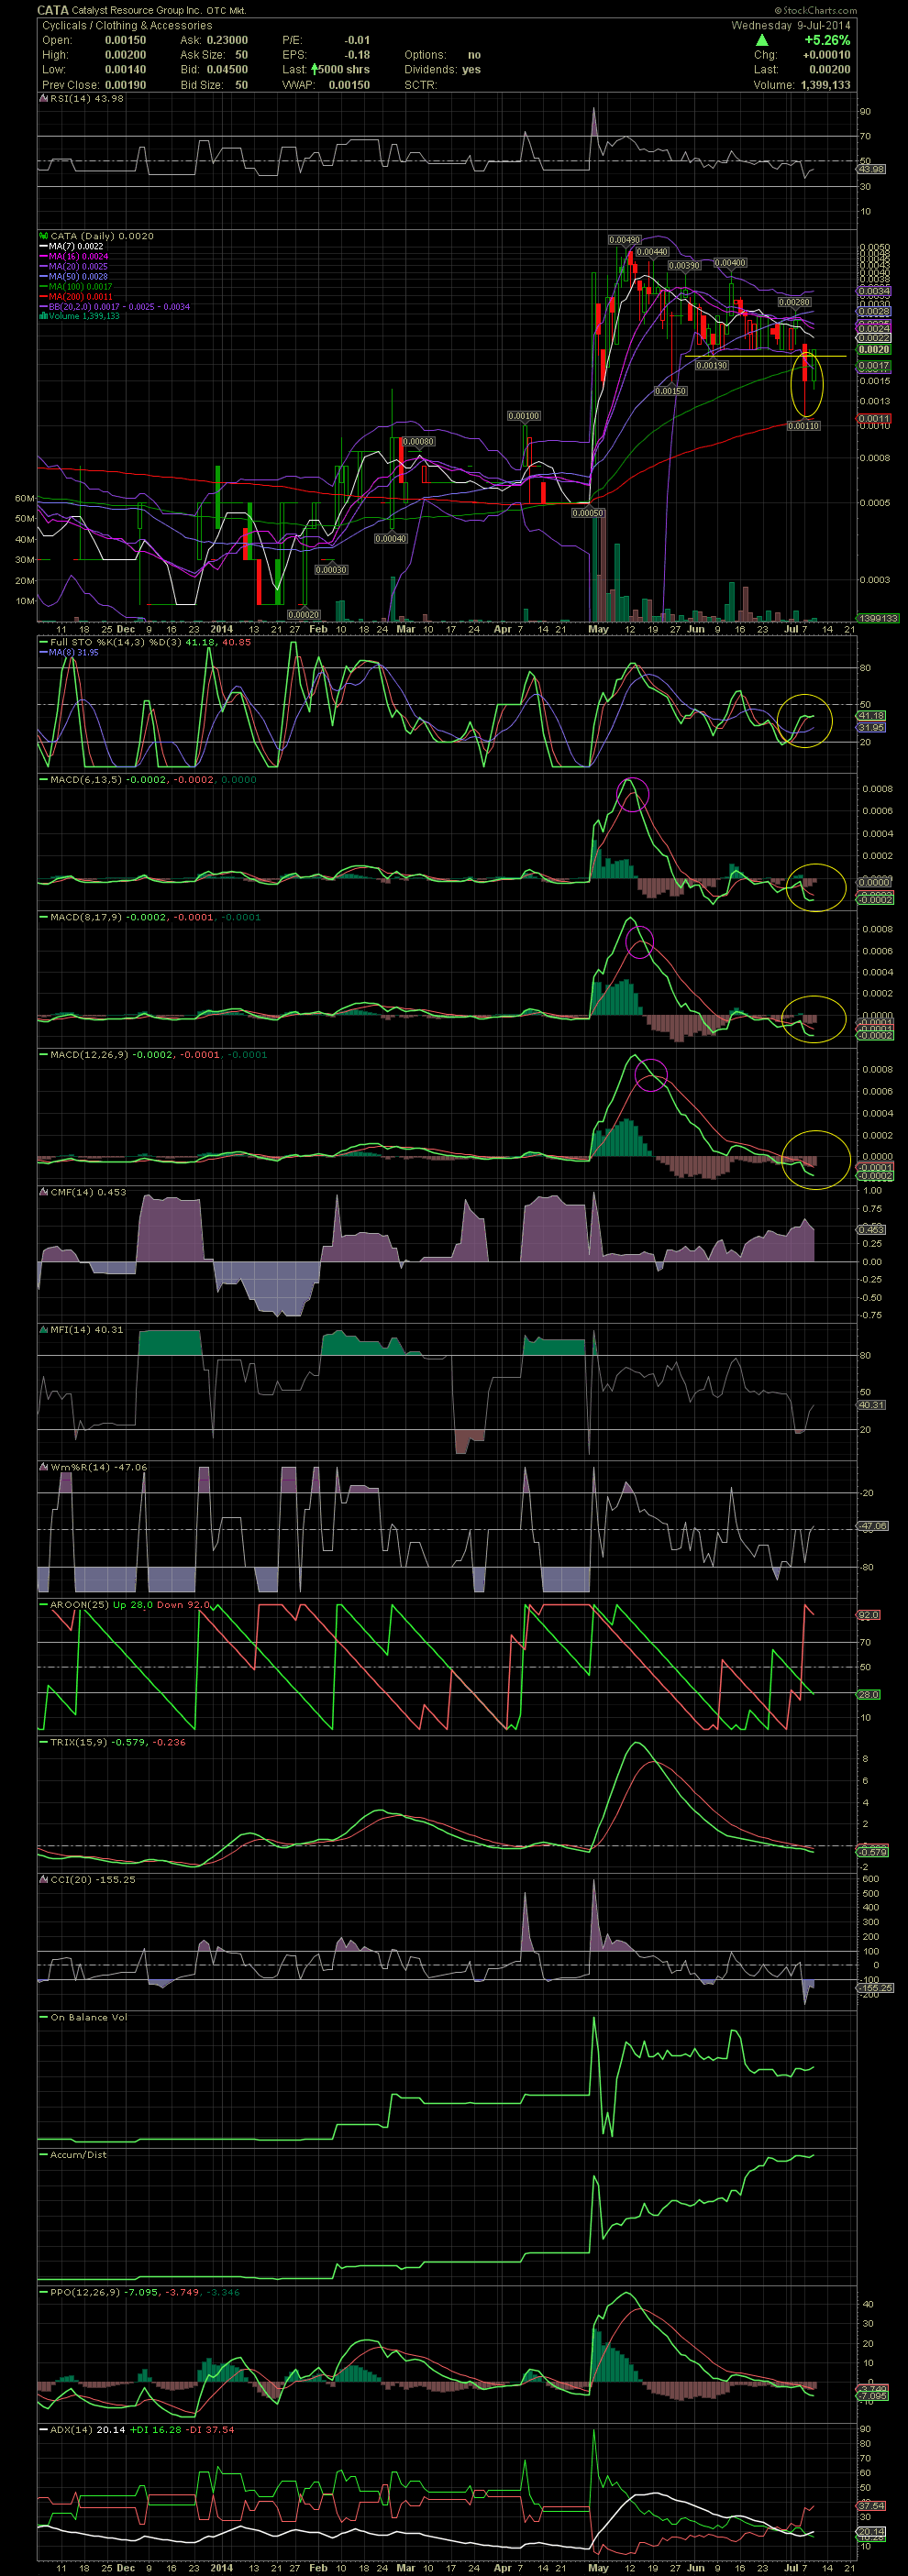
$CATA Daily Chart ~ Back Inside the Lower Bollie
I mostly show charts when a stock gets overbought when the price gets too far outside the upper bollie leading to a short term sell signal. The opposite also occurs when a stock falls outside the lower bollie. Although CATA is not a chart play yet, there are still occasions when the indicators warrant a look. The last two days, CATA fell way outside the lower bollie before closing inside the bands again. The MACDs still aren't confirming a buy signal, but a drop as was seen the last two days needs to be snagged when one is accumulating a stock for the longer term. Hearing things might get interesting for us in CATA over the next couple of weeks. GLTA
I mostly show charts when a stock gets overbought when the price gets too far outside the upper bollie leading to a short term sell signal. The opposite also occurs when a stock falls outside the lower bollie. Although CATA is not a chart play yet, there are still occasions when the indicators warrant a look. The last two days, CATA fell way outside the lower bollie before closing inside the bands again. The MACDs still aren't confirming a buy signal, but a drop as was seen the last two days needs to be snagged when one is accumulating a stock for the longer term. Hearing things might get interesting for us in CATA over the next couple of weeks. GLTA