Posted On: 07/08/2014 11:16:52 PM
Post# of 2561

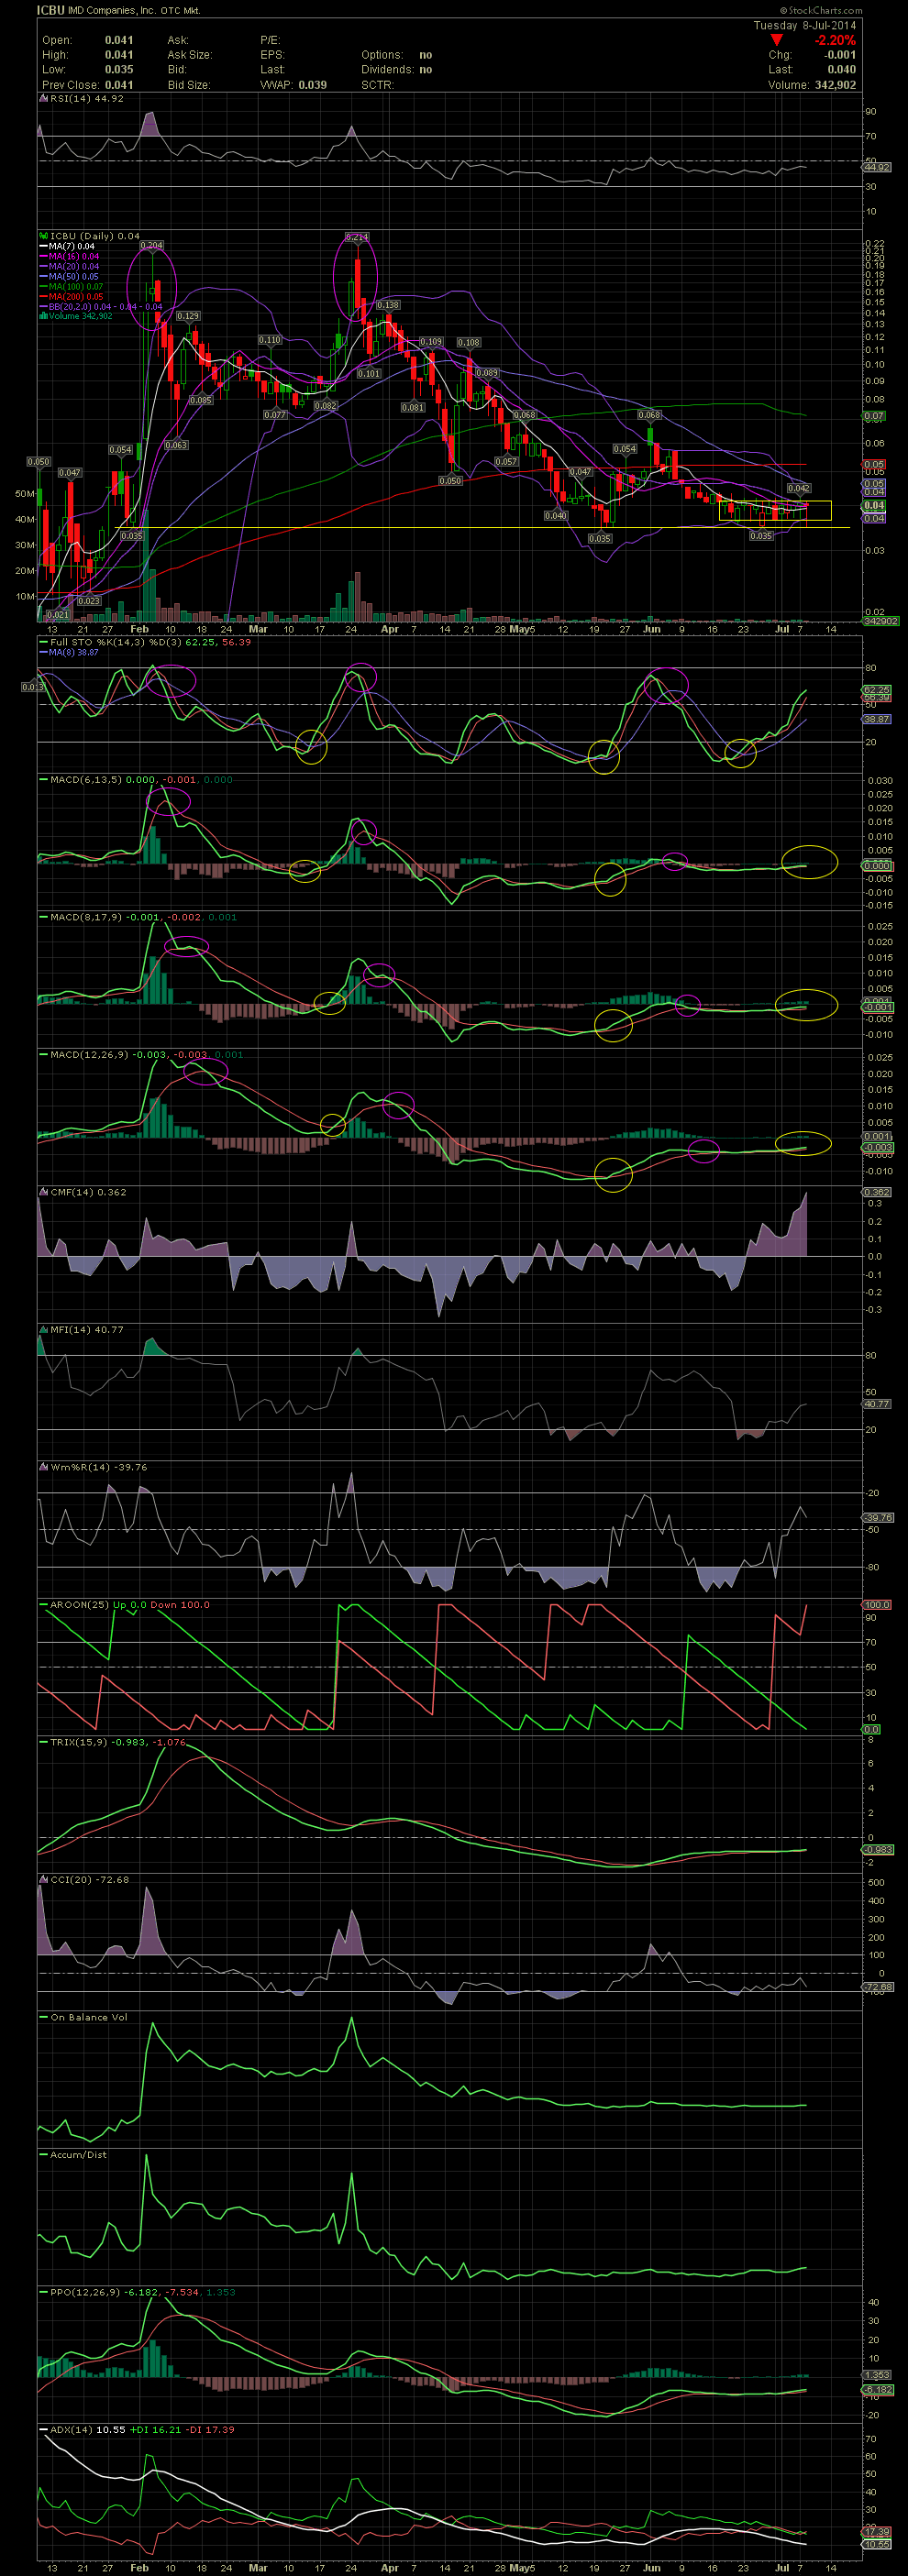
ICBU Daily Chart ~ Still in a Consolidation Box
ICBU is still trending within a consolidation box within a tight range of .035-.042. Although the FullSto is showing a positive crossover, there is very little confirmation from the MACDs, which are basically flatlined. The key with the ICBU chart is to watch for a breakout of the consolidation box. A close of .043/.044 would indicate that the stock is ready for a leg up. Just above is the declining MA50 near .0455 and the MA200 just above .05. I began accumulating a few ICBU this week from the .037s to .041s so far. I'm hoping to build a decent position before the week is up as I believe the sideways trending is just about over. GLTA
ICBU is still trending within a consolidation box within a tight range of .035-.042. Although the FullSto is showing a positive crossover, there is very little confirmation from the MACDs, which are basically flatlined. The key with the ICBU chart is to watch for a breakout of the consolidation box. A close of .043/.044 would indicate that the stock is ready for a leg up. Just above is the declining MA50 near .0455 and the MA200 just above .05. I began accumulating a few ICBU this week from the .037s to .041s so far. I'm hoping to build a decent position before the week is up as I believe the sideways trending is just about over. GLTA