Posted On: 06/29/2014 9:00:16 PM
Post# of 2561

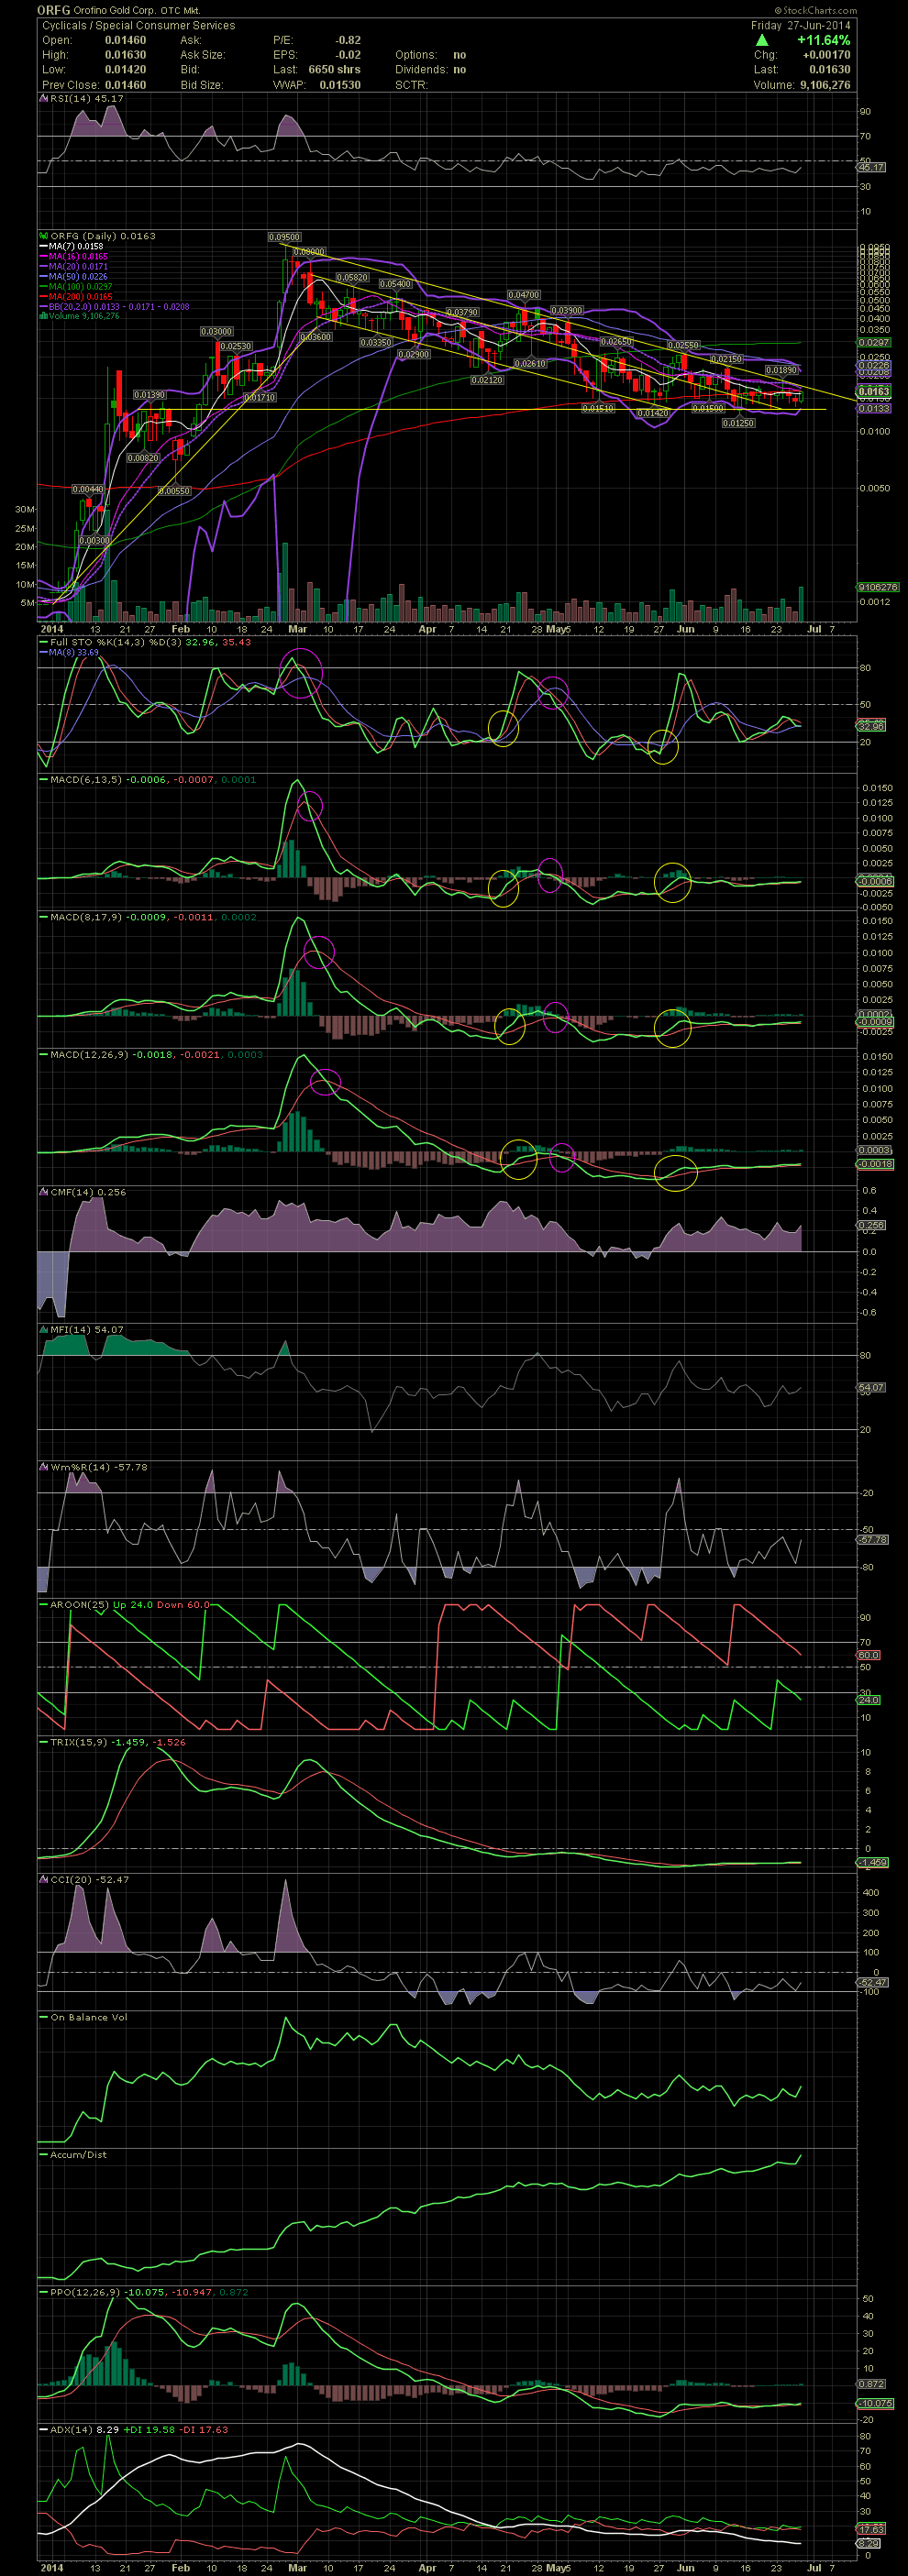
ORFG Daily Chart ~ Set Finally for a Run?
The declining channel that ORFG has been trading in since late Feb has come to a point where it will have to do one thing or another. The stock has now based near the .013/.014 since late May while also seeing its highs capped by the declining tops line since the stock was .095. Over the last 3 weeks the MA20 has also acted as resistance for any upside. ORFG has also traded near the MA200 for weeks. A break and close above the 200 along with a close over .0215 would signal that the momentum has shifted to a breakout to the upside. A few short term targets would be .0215, .0255, .039, and .047. Those could be seen during this shortened trading week should things begin tomorrow. Friday's volume spike, which was the highest since March 26 and the third highest since late Feb, also closed at the high of the day. Another volume before movement scenario? We'll see what happens this week. GLTA
The declining channel that ORFG has been trading in since late Feb has come to a point where it will have to do one thing or another. The stock has now based near the .013/.014 since late May while also seeing its highs capped by the declining tops line since the stock was .095. Over the last 3 weeks the MA20 has also acted as resistance for any upside. ORFG has also traded near the MA200 for weeks. A break and close above the 200 along with a close over .0215 would signal that the momentum has shifted to a breakout to the upside. A few short term targets would be .0215, .0255, .039, and .047. Those could be seen during this shortened trading week should things begin tomorrow. Friday's volume spike, which was the highest since March 26 and the third highest since late Feb, also closed at the high of the day. Another volume before movement scenario? We'll see what happens this week. GLTA