Posted On: 06/29/2014 5:06:31 PM
Post# of 2561

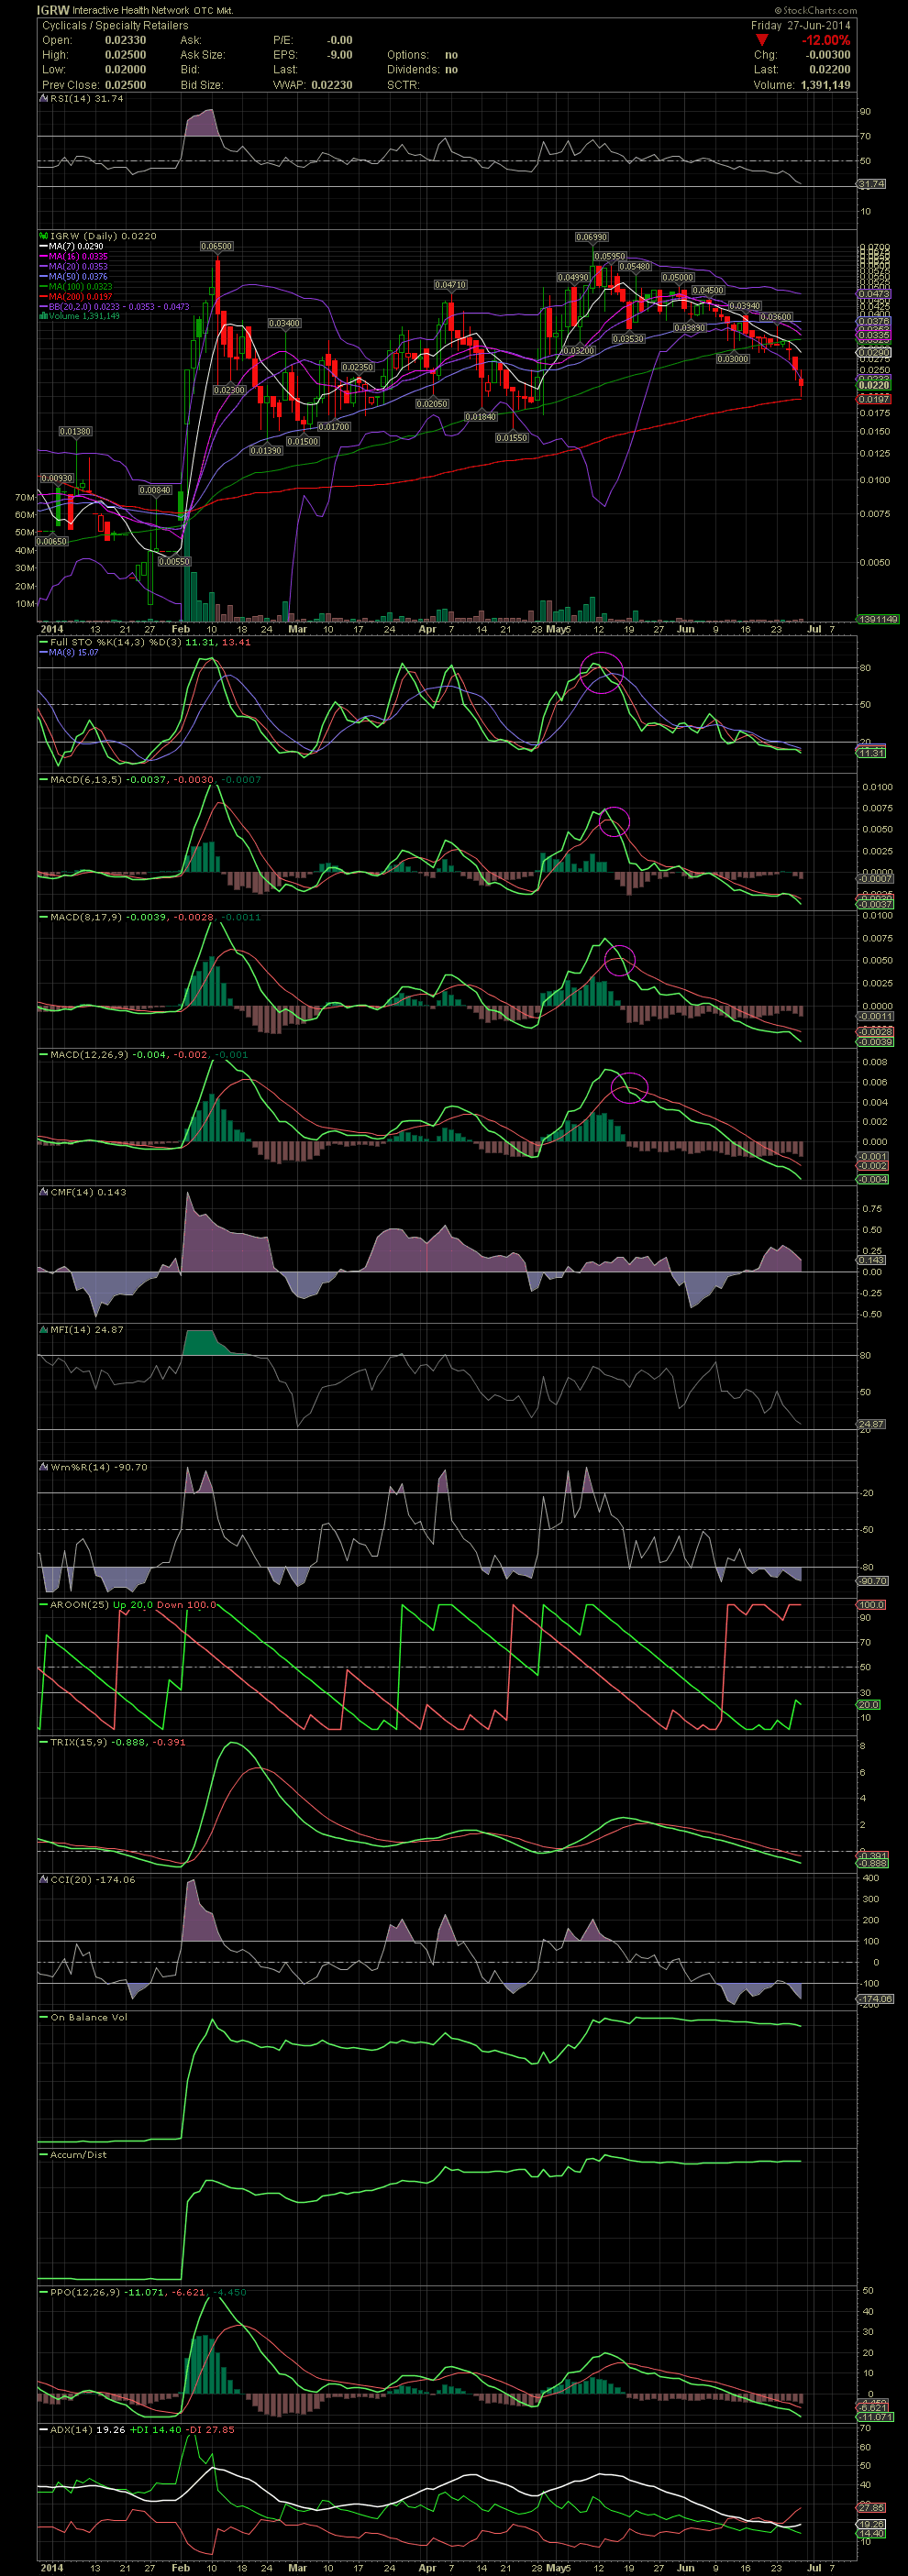
$IGRW Daily Chart ~ Right at the MA200
IGRW was a good one for three previous runs. Since early May, the stock has fallen from .0699, and way outside the upper bollie, to just above the MA200 on Friday. A capitulation day on large volume would be something that wouldn't mind seeing. I would now begin to watch for a little sideways trending at the 200 to see if a bottom can finally be put in. Keep your eyes on the declining FullSto and MACDs for a signal that momentum might be changing. GLTA
IGRW was a good one for three previous runs. Since early May, the stock has fallen from .0699, and way outside the upper bollie, to just above the MA200 on Friday. A capitulation day on large volume would be something that wouldn't mind seeing. I would now begin to watch for a little sideways trending at the 200 to see if a bottom can finally be put in. Keep your eyes on the declining FullSto and MACDs for a signal that momentum might be changing. GLTA