Posted On: 06/15/2014 1:06:50 PM
Post# of 2561
PNTV Weekly Chart ~ Gradually Turning Positive
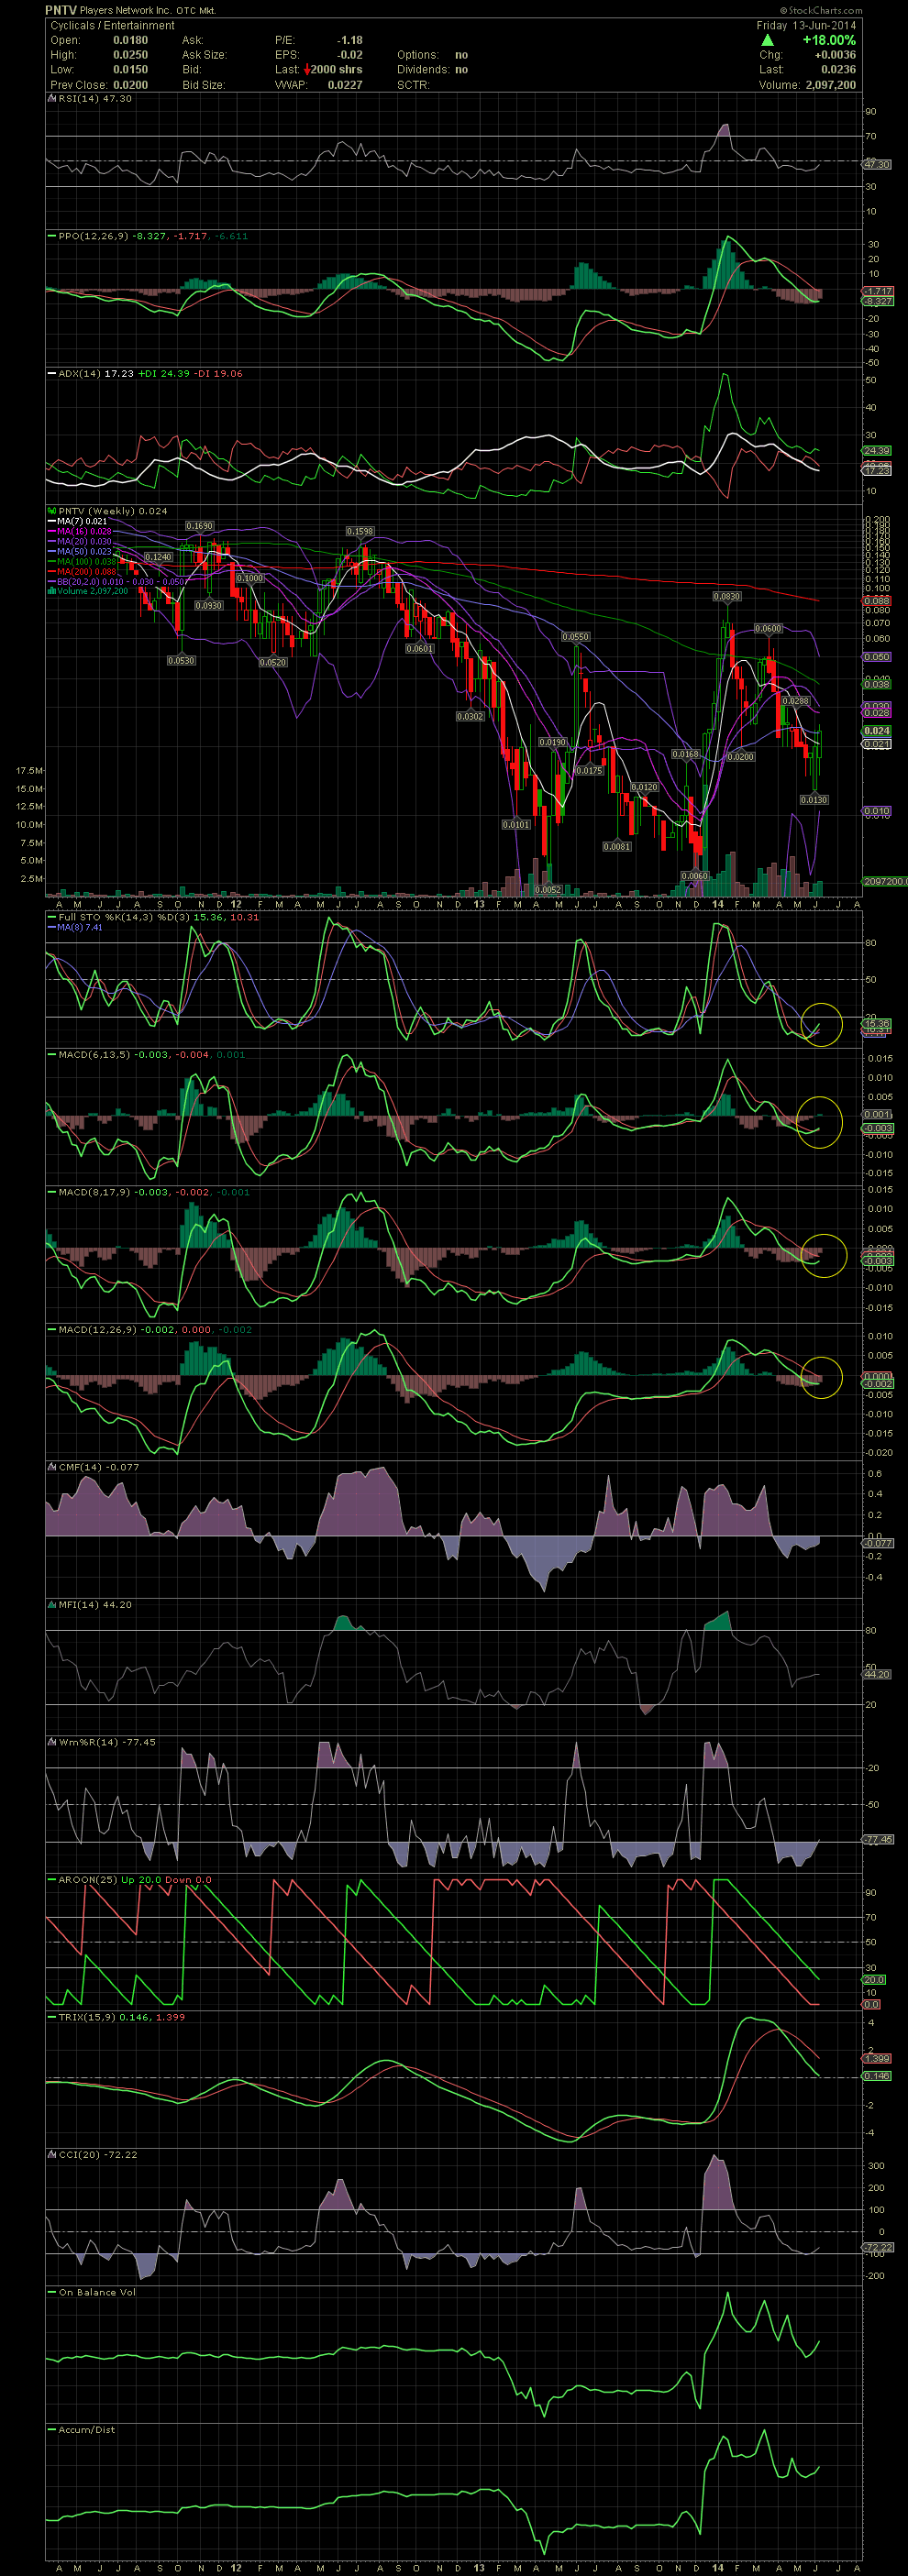
Here's a longer term view of PNTV with a weekly chart. As I mentioned in my previous PNTV Daily Chart post, one can see my targets on the chart below. The .06 and .083 resistance points followed by the highs in the mid teens established in late 2011 and mid 2012. The FullSto and MACDs are curling and beginning to level out and crossover to the upside from oversold levels. Most of the remaining, long term, indicators are in oversold territory. So the future potential for profits are there even though PNTV has already rallied approx 60% from the lows of just two weeks ago. GLTA

Here's a longer term view of PNTV with a weekly chart. As I mentioned in my previous PNTV Daily Chart post, one can see my targets on the chart below. The .06 and .083 resistance points followed by the highs in the mid teens established in late 2011 and mid 2012. The FullSto and MACDs are curling and beginning to level out and crossover to the upside from oversold levels. Most of the remaining, long term, indicators are in oversold territory. So the future potential for profits are there even though PNTV has already rallied approx 60% from the lows of just two weeks ago. GLTA


