Investors Hangout Stock Message Boards Logo
  • Home
  • Mailbox
  • Boards
  • Favorites
  • Whats Hot!
  • Login - Join Now!
Bakken Energy Corp BKEN
Posted On: 05/08/2014 9:57:18 AM
Post# of 4274
Avatar
Posted By: Big Tuna
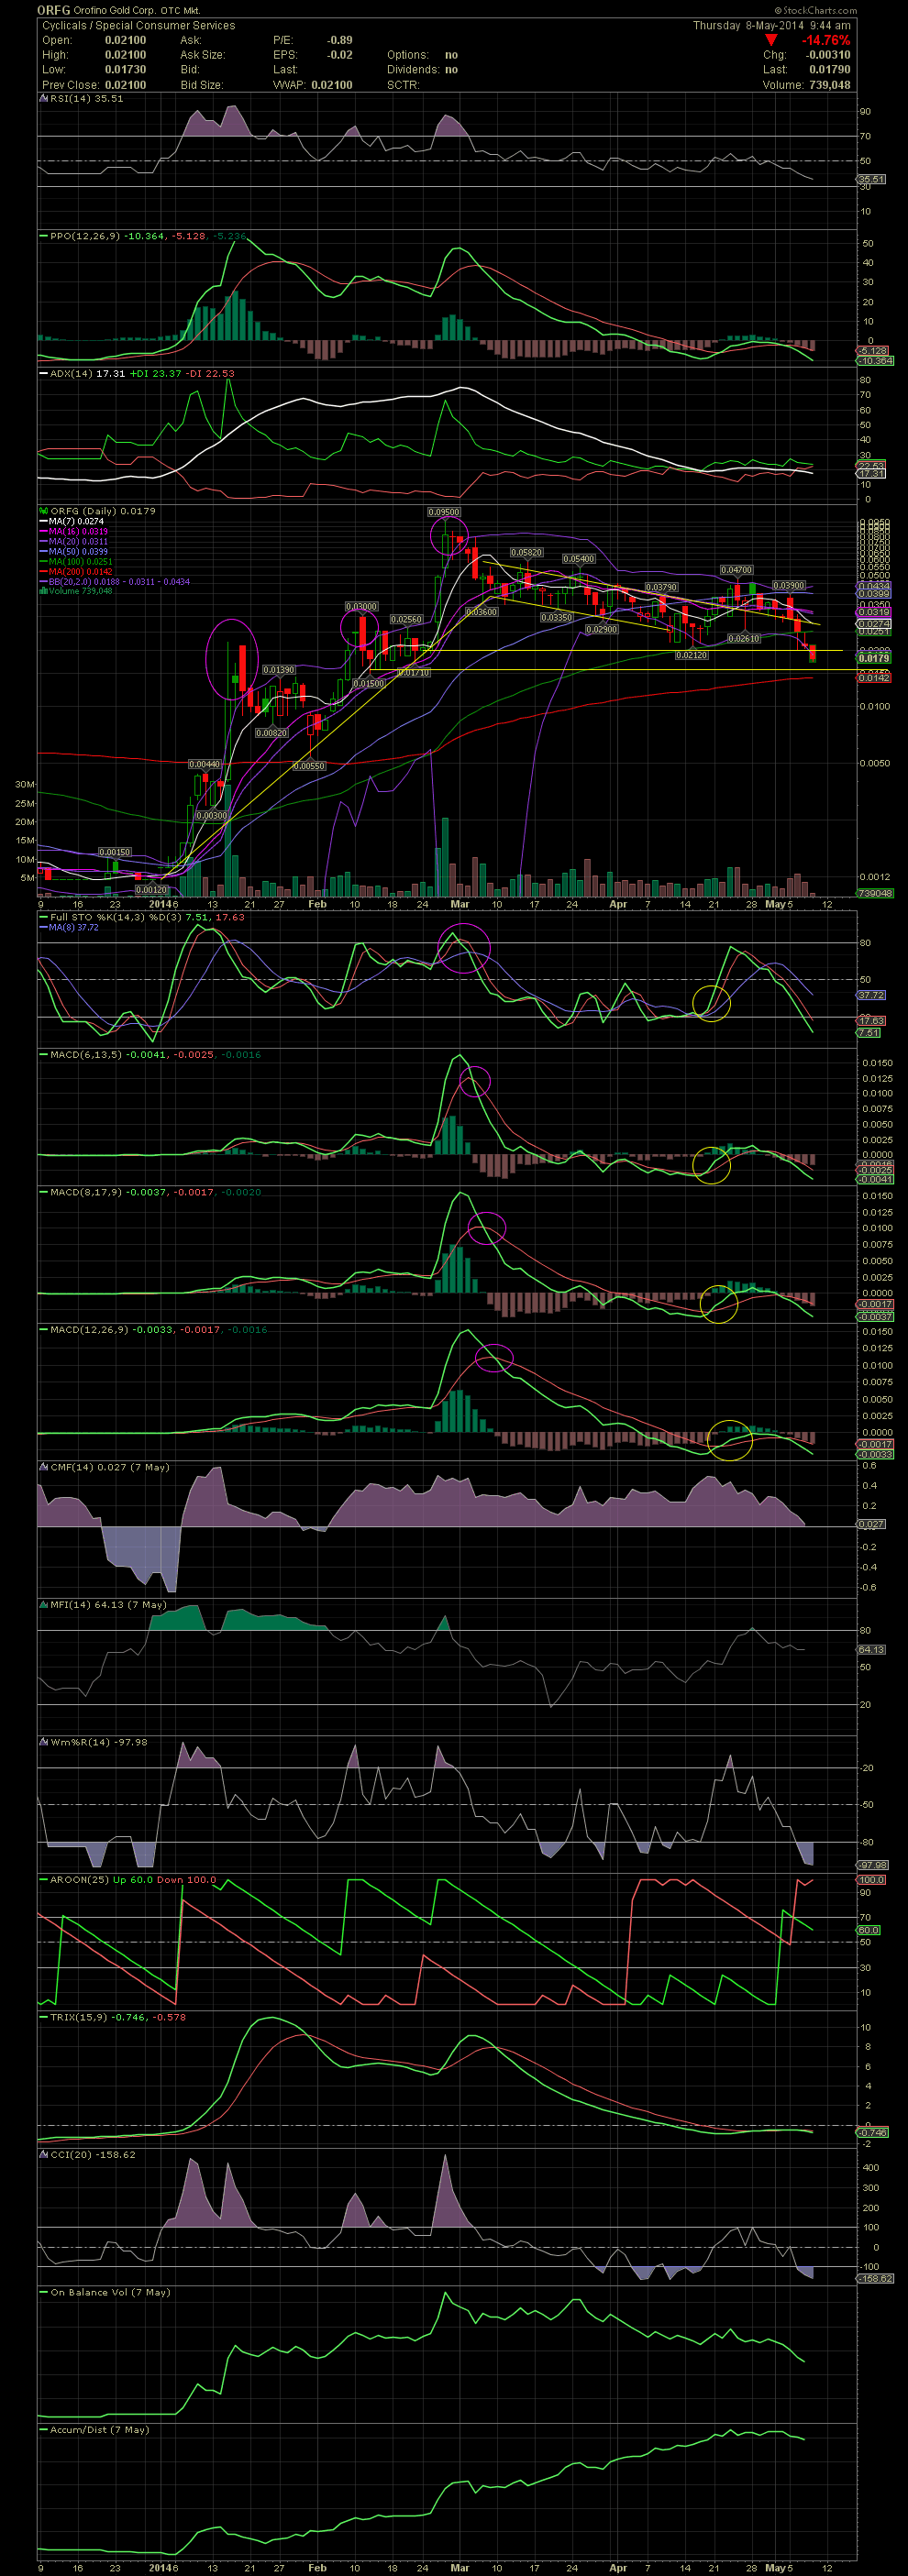
Unfortunately, while many have been suggesting that the chart has been oversold for weeks, I've had these horizontal support lines on the chart for some time. As mentioned, if the .02 is broken, look for a quick drop to the .015/.017 grouping of February. As far as being hugely oversold, that is now finally just beginning to enter those levels, check FullSto and MACDs. Once again, I've been trying to catch a falling knife while the charts have been saying that ORFG is going down further. See that MA200? Hopefully we don't get to level, but it's at .0142.

2009182311_ORFG.png


(0)
(0)


  • New Post - Investors HangoutNew Post

  • Public Reply - Investors HangoutPublic Reply

  • Private Reply - Investors HangoutPrivate Reply

  • Board - Investors HangoutBoard

  • More - Investors HangoutMore

  • Keep Post - Investors HangoutKeep Post
  • Report Post - Investors HangoutReport Post
  • Home - Investors HangoutHome
  • Mailbox - Investors HangoutMailbox
  • Boards - Investors HangoutBoards
  • Favorites - Investors HangoutFavorites
  • Whats Hot! - Investors HangoutWhats Hot!
  • Settings - Investors HangoutSettings
  • Login - Investors HangoutLogin
  • Live Site - Investors HangoutLive Site