Posted On: 04/08/2014 10:26:23 AM
Post# of 338556

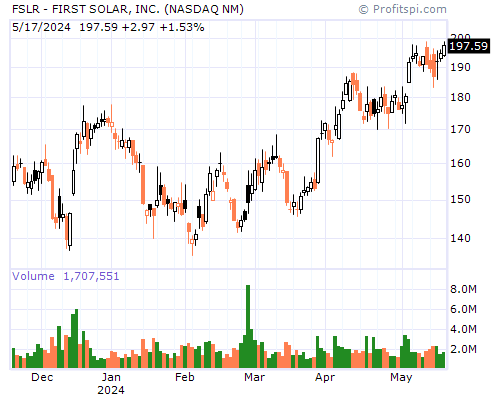
FSLR Stock Chart and Technical Analysis - Tue, Apr 8th, 2014 $FSLR
Period Moving Average Price Change Percent Change Average Volume
5 Day 16.76 -1.02 -5.88% 75,278,727
20 Day 17.13 -0.95 -5.50% 97,823,633
50 Day 16.86 +0.01 +0.06% 106,640,594
100 Day 16.37 +2.00 +13.97% 105,471,656
200 Day 15.27 +3.63 +28.61% 99,809,281
Year to Date 16.83 +0.75 +4.82% 111,463,414
Period Raw Stochastic Stochastic %K Stochastic %D Average True Range
9 Day 10.00% 8.96% 17.49% 0.35
14 Day 7.07% 6.30% 13.62% 0.34
20 Day 7.07% 6.30% 14.52% 0.34
50 Day 10.00% 19.92% 34.78% 0.31
100 Day 55.35% 59.36% 67.30% 0.29
Period Relative Strength Percent R Historic Volatility MACD Oscillator
9 Day 28.89% 90.00% 17.59% -0.45
14 Day 36.75% 92.93% 21.07% -0.64
20 Day 41.70% 92.93% 21.64% -0.65
50 Day 49.96% 90.00% 21.34% -0.39
100 Day 53.18% 44.65% 21.07% +0.10