Posted On: 04/02/2014 7:48:07 PM
Post# of 2561

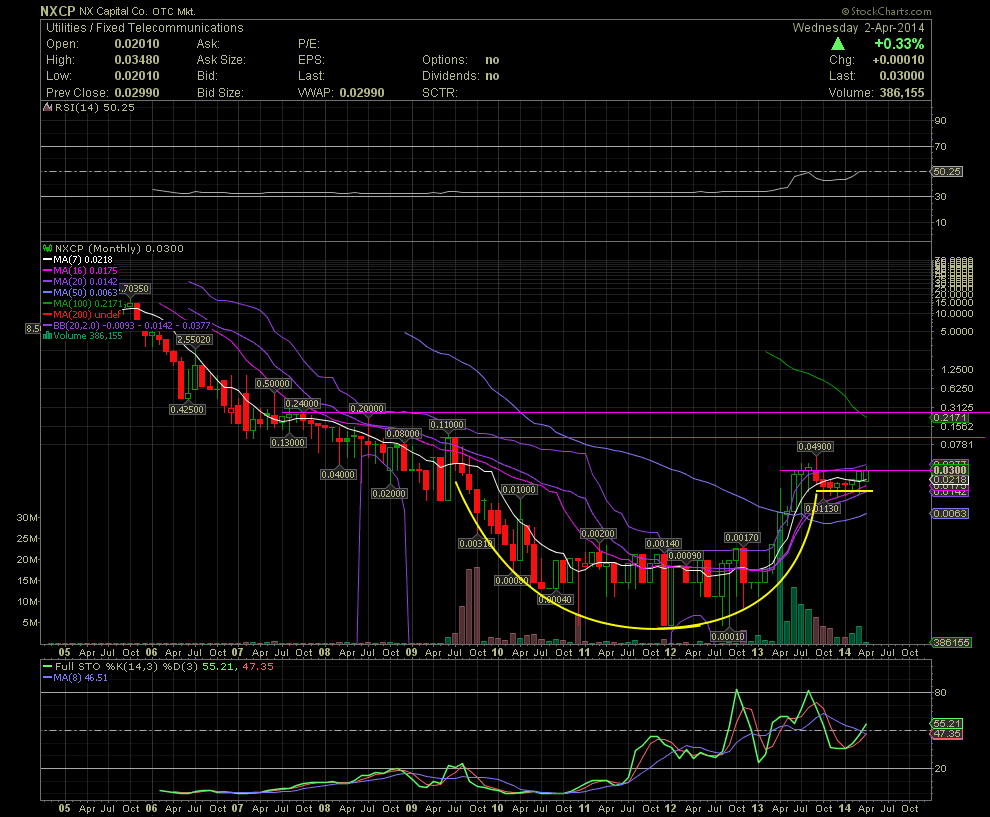
$NXCP Monthly Chart ~ A Huge Cup and Handle Formation
I always check the Weekly and Monthly charts to see what resistance levels might be above when the Daily chart no longer shows areas that have moved off the charts. I also look for longer term formations. Of interest on the Monthly chart below, is the huge, cup and handle formation. A close at .04, on large volume, would signal a breakout above the upper channel line of the handle. Since I was only able to find less than 20k shares traded in those candle wicks above .04, let's move the closing confirmation to .05 so no one has any question of what would be considered a break above the highest point in the handle. The old high was one trade of 2k at .049. Should the handle be exceeded, next up would be the horizontal resistance lines of .11 and .24. I really don't see a lot of resistance once the share price breaks into the .05+ level. As one can see on the volume bars prior to the high of .11 established in mid 2009, there wasn't a whole lot of volume. Once again, when the company executes and delivers, we'll be Blue Skyin'! GLTA
I always check the Weekly and Monthly charts to see what resistance levels might be above when the Daily chart no longer shows areas that have moved off the charts. I also look for longer term formations. Of interest on the Monthly chart below, is the huge, cup and handle formation. A close at .04, on large volume, would signal a breakout above the upper channel line of the handle. Since I was only able to find less than 20k shares traded in those candle wicks above .04, let's move the closing confirmation to .05 so no one has any question of what would be considered a break above the highest point in the handle. The old high was one trade of 2k at .049. Should the handle be exceeded, next up would be the horizontal resistance lines of .11 and .24. I really don't see a lot of resistance once the share price breaks into the .05+ level. As one can see on the volume bars prior to the high of .11 established in mid 2009, there wasn't a whole lot of volume. Once again, when the company executes and delivers, we'll be Blue Skyin'! GLTA