Posted On: 04/02/2014 1:01:26 PM
Post# of 36760
ORFG Verified that the same group running ORFG is the same group who ran CYB% here you go:
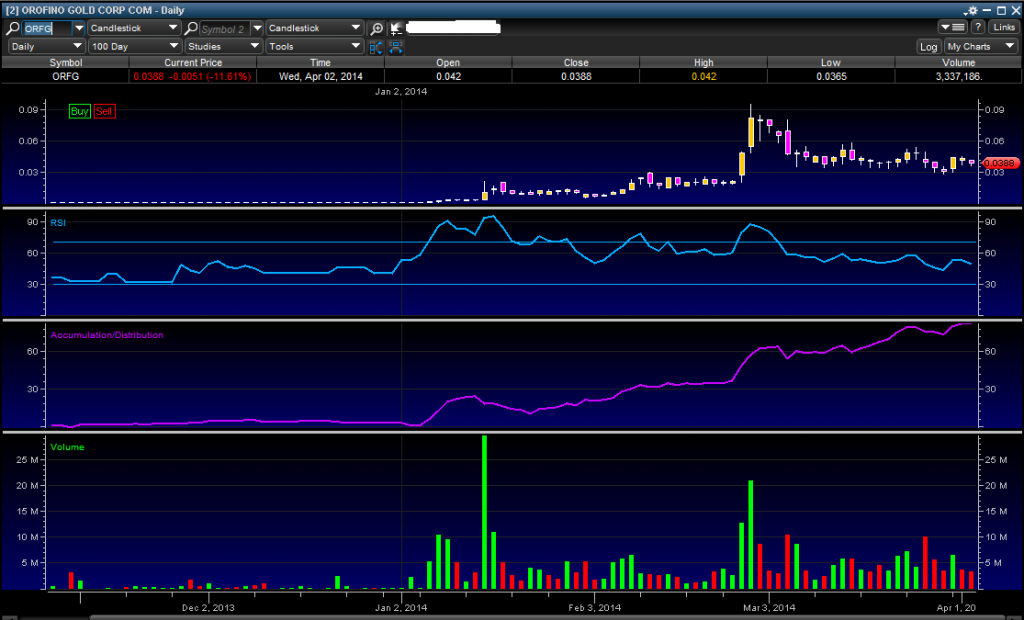
ORFG chart:
CYB% chart:
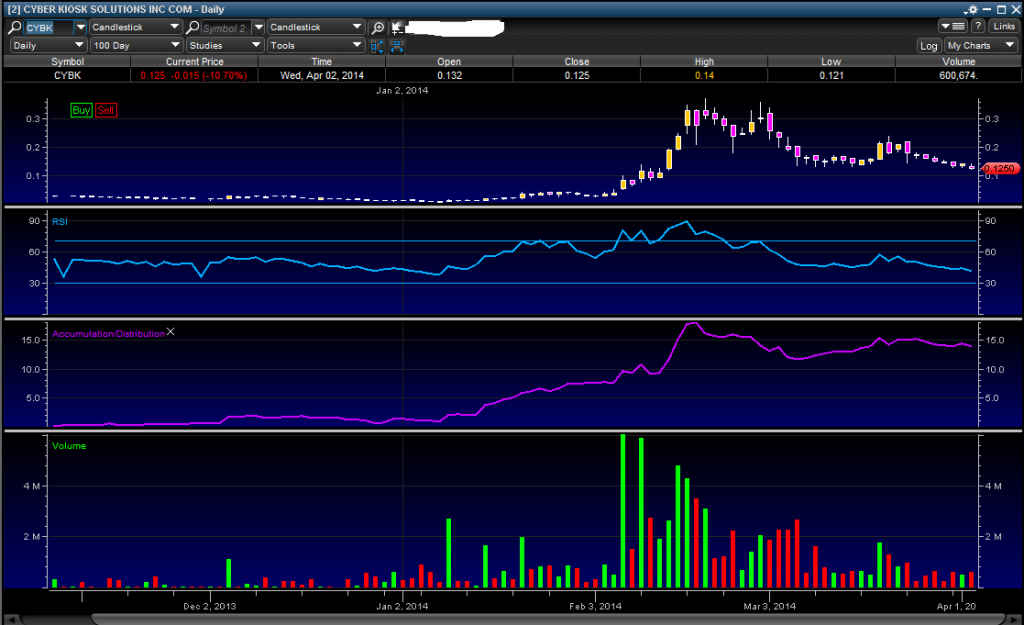
Note: you can already notice the similarities!
Here's the chart overlay!
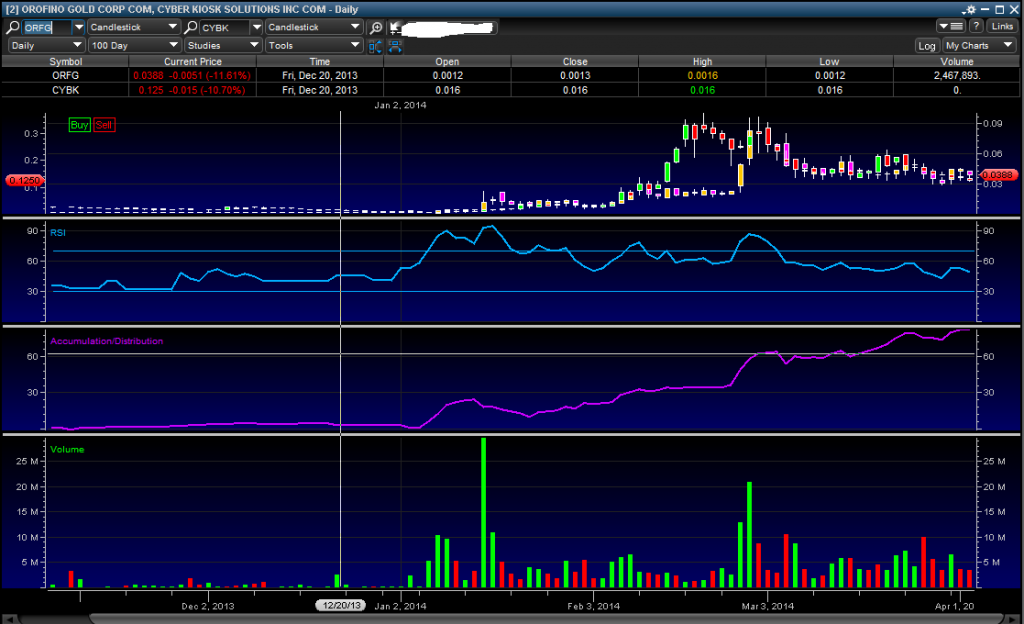
Note: If they look earily simular then thats because they are run and accumulated by virtually the same group...Hence how the charts match near perfectly...
ORFG long and strong!
ORFG chart:

CYB% chart:

Note: you can already notice the similarities!
Here's the chart overlay!

Note: If they look earily simular then thats because they are run and accumulated by virtually the same group...Hence how the charts match near perfectly...
ORFG long and strong!