Posted On: 03/27/2014 10:37:57 AM
Post# of 338556

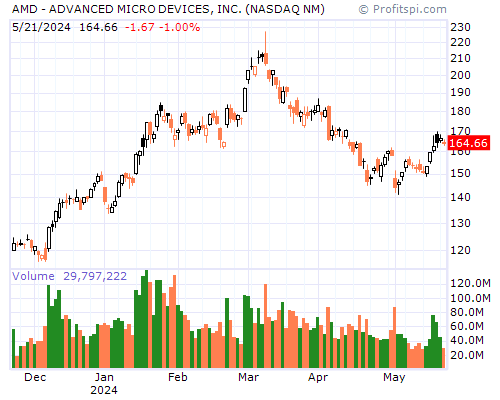
AMD Stock Chart and Technical Analysis - Thu, Mar 27th, 2014 $AMD
Period Moving Average Price Change Percent Change Average Volume
5 Day 17.33 -0.57 -3.18% 102,059,789
20 Day 17.19 +0.86 +5.22% 109,484,398
50 Day 16.87 +0.58 +3.46% 115,425,617
100 Day 16.15 +3.38 +24.19% 104,780,805
200 Day 15.12 +4.23 +32.24% 101,206,117
Year to Date 16.82 +1.78 +11.43% 114,524,023
Period Raw Stochastic Stochastic %K Stochastic %D Average True Range
9 Day 35.85% 34.78% 40.82% 0.34
14 Day 46.46% 38.32% 42.84% 0.34
20 Day 63.04% 57.90% 60.77% 0.33
50 Day 65.48% 60.24% 62.61% 0.30
100 Day 83.92% 81.48% 82.58% 0.29
Period Relative Strength Percent R Historic Volatility MACD Oscillator
9 Day 54.31% 64.15% 22.89% -0.12
14 Day 55.26% 53.54% 22.10% -0.06
20 Day 55.72% 36.96% 23.60% +0.06
50 Day 56.67% 34.52% 21.54% +0.38
100 Day 56.89% 16.08% 21.05% +1.09