Posted On: 03/24/2014 9:44:44 AM
Post# of 338556

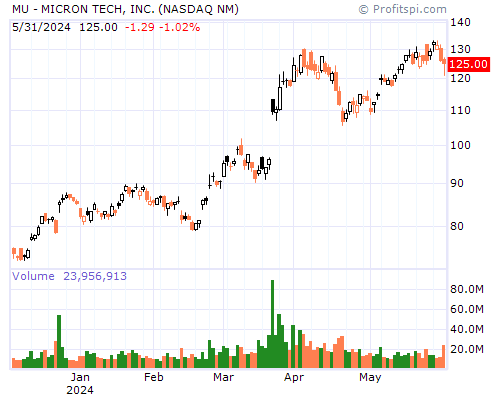
MU Stock Chart and Technical Analysis - Mon, Mar 24th, 2014 $MU
Period Moving Average Price Change Percent Change Average Volume
5 Day 17.53 +0.44 +2.57% 100,490,203
20 Day 17.07 +1.02 +6.17% 104,292,570
50 Day 16.83 +0.72 +4.28% 114,020,695
100 Day 16.06 +3.32 +23.33% 103,927,000
200 Day 15.06 +4.35 +32.95% 101,130,133
Year to Date 16.80 +1.98 +12.72% 114,457,922
Period Raw Stochastic Stochastic %K Stochastic %D Average True Range
9 Day 62.20% 72.92% 75.79% 0.34
14 Day 62.20% 76.14% 81.47% 0.33
20 Day 74.74% 81.91% 84.20% 0.32
50 Day 75.63% 82.55% 84.81% 0.30
100 Day 88.65% 91.88% 93.26% 0.29
Period Relative Strength Percent R Historic Volatility MACD Oscillator
9 Day 59.88% 37.80% 24.68% +0.34
14 Day 59.51% 37.80% 23.97% +0.34
20 Day 58.98% 25.26% 23.25% +0.61
50 Day 58.25% 24.37% 22.16% +0.84
100 Day 57.77% 11.35% 21.02% +1.62