Posted On: 03/23/2014 3:26:57 PM
Post# of 2561

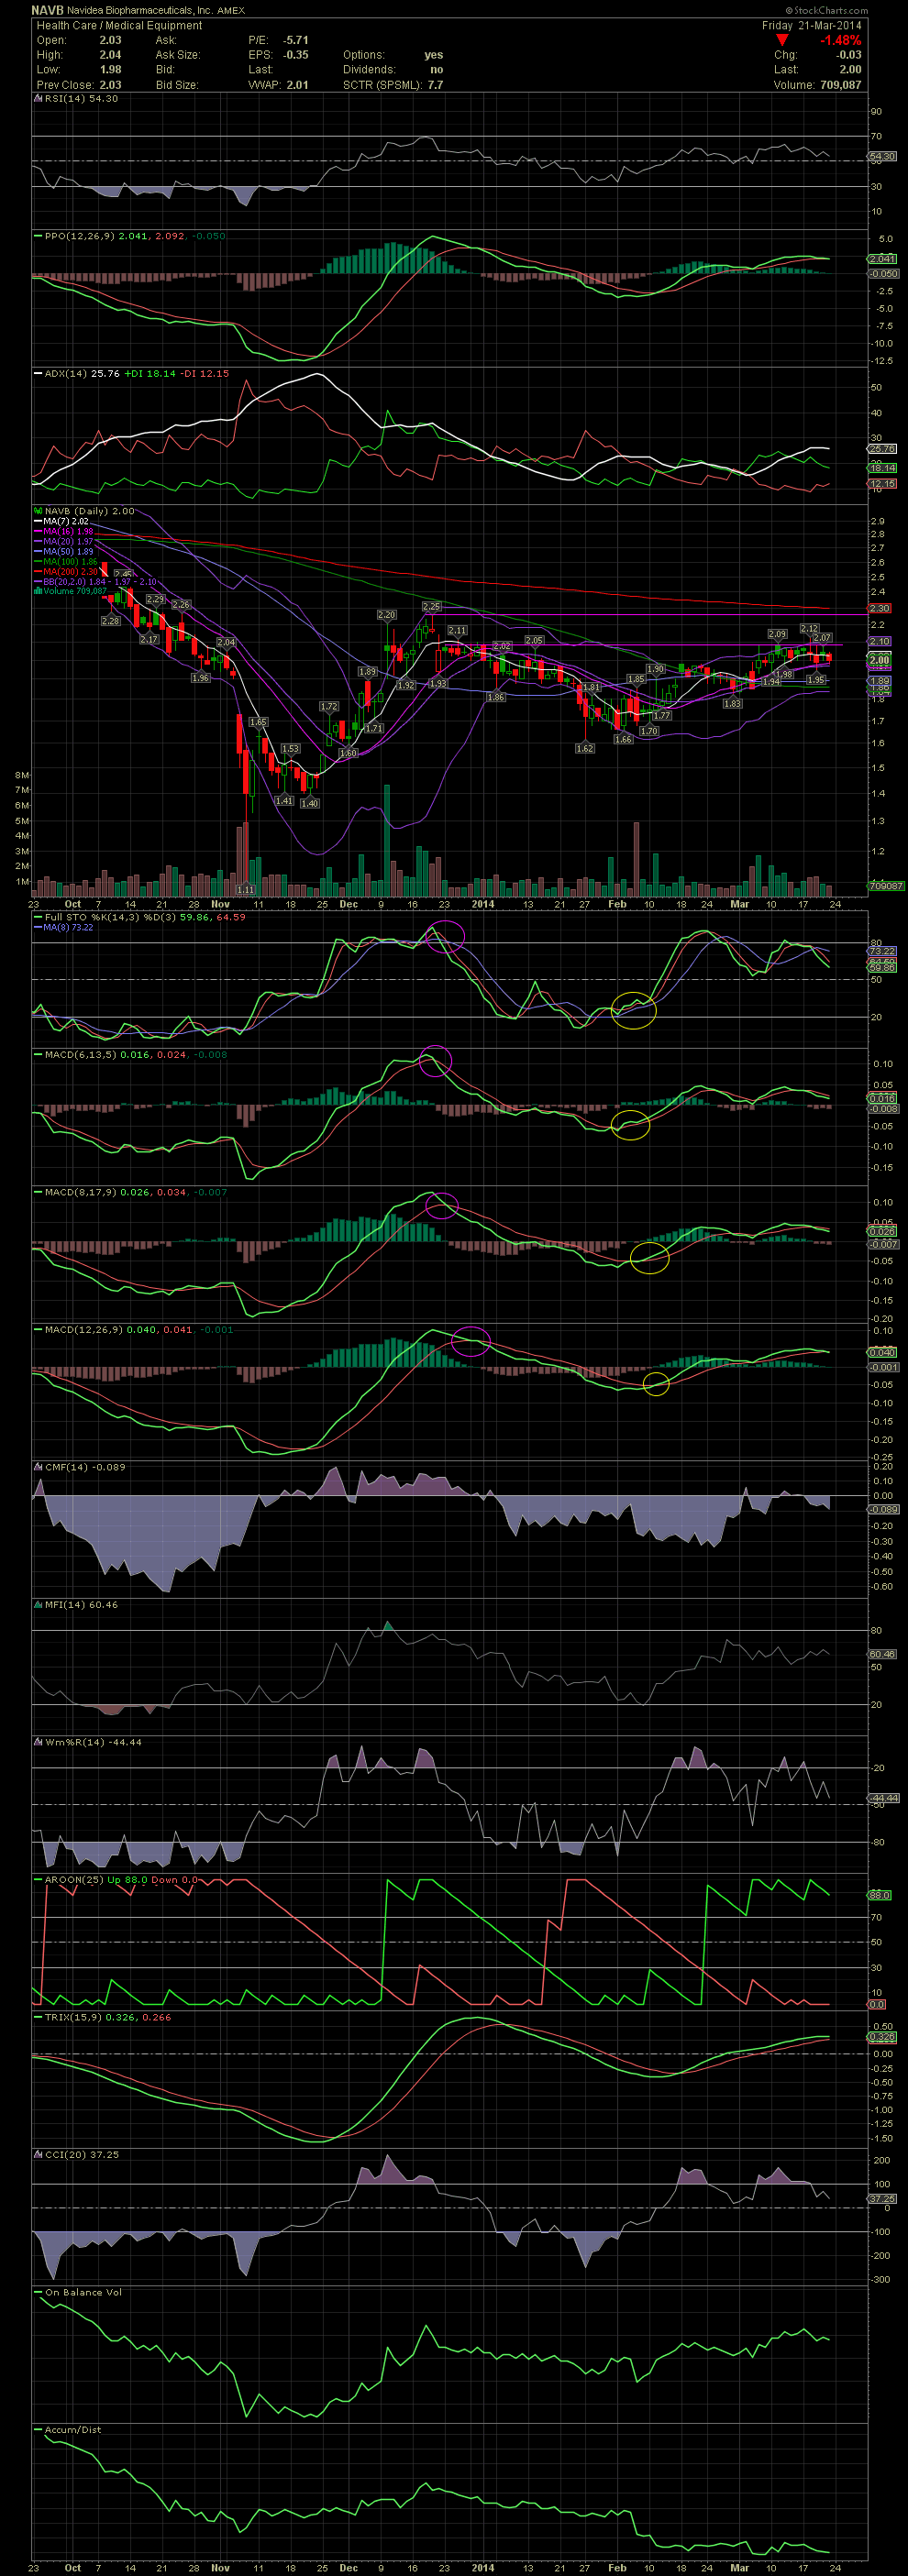
NAVB Daily Chart ~ Trending Between the High 1.90s to 2.09s
As I mentioned on my last NAVB chart, I added another 2k shares to those 1.70s - 1.91 that a few of us are holding while waiting for a break over that stubborn horizontal resistance line. That line has been in effect since late December. Over the last three weeks, there have been numerous attempts to move above it, but no luck yet. When it does finally make it, I would target the next horizontal point of 2.25 and the slightly declining MA200 at 2.30 today. Should both of these resistance points be taken out, we could see a sharp pop as we've seen lately with a few others that we've recently taken profits on. GLTA
As I mentioned on my last NAVB chart, I added another 2k shares to those 1.70s - 1.91 that a few of us are holding while waiting for a break over that stubborn horizontal resistance line. That line has been in effect since late December. Over the last three weeks, there have been numerous attempts to move above it, but no luck yet. When it does finally make it, I would target the next horizontal point of 2.25 and the slightly declining MA200 at 2.30 today. Should both of these resistance points be taken out, we could see a sharp pop as we've seen lately with a few others that we've recently taken profits on. GLTA