Posted On: 03/16/2014 8:23:19 PM
Post# of 2561

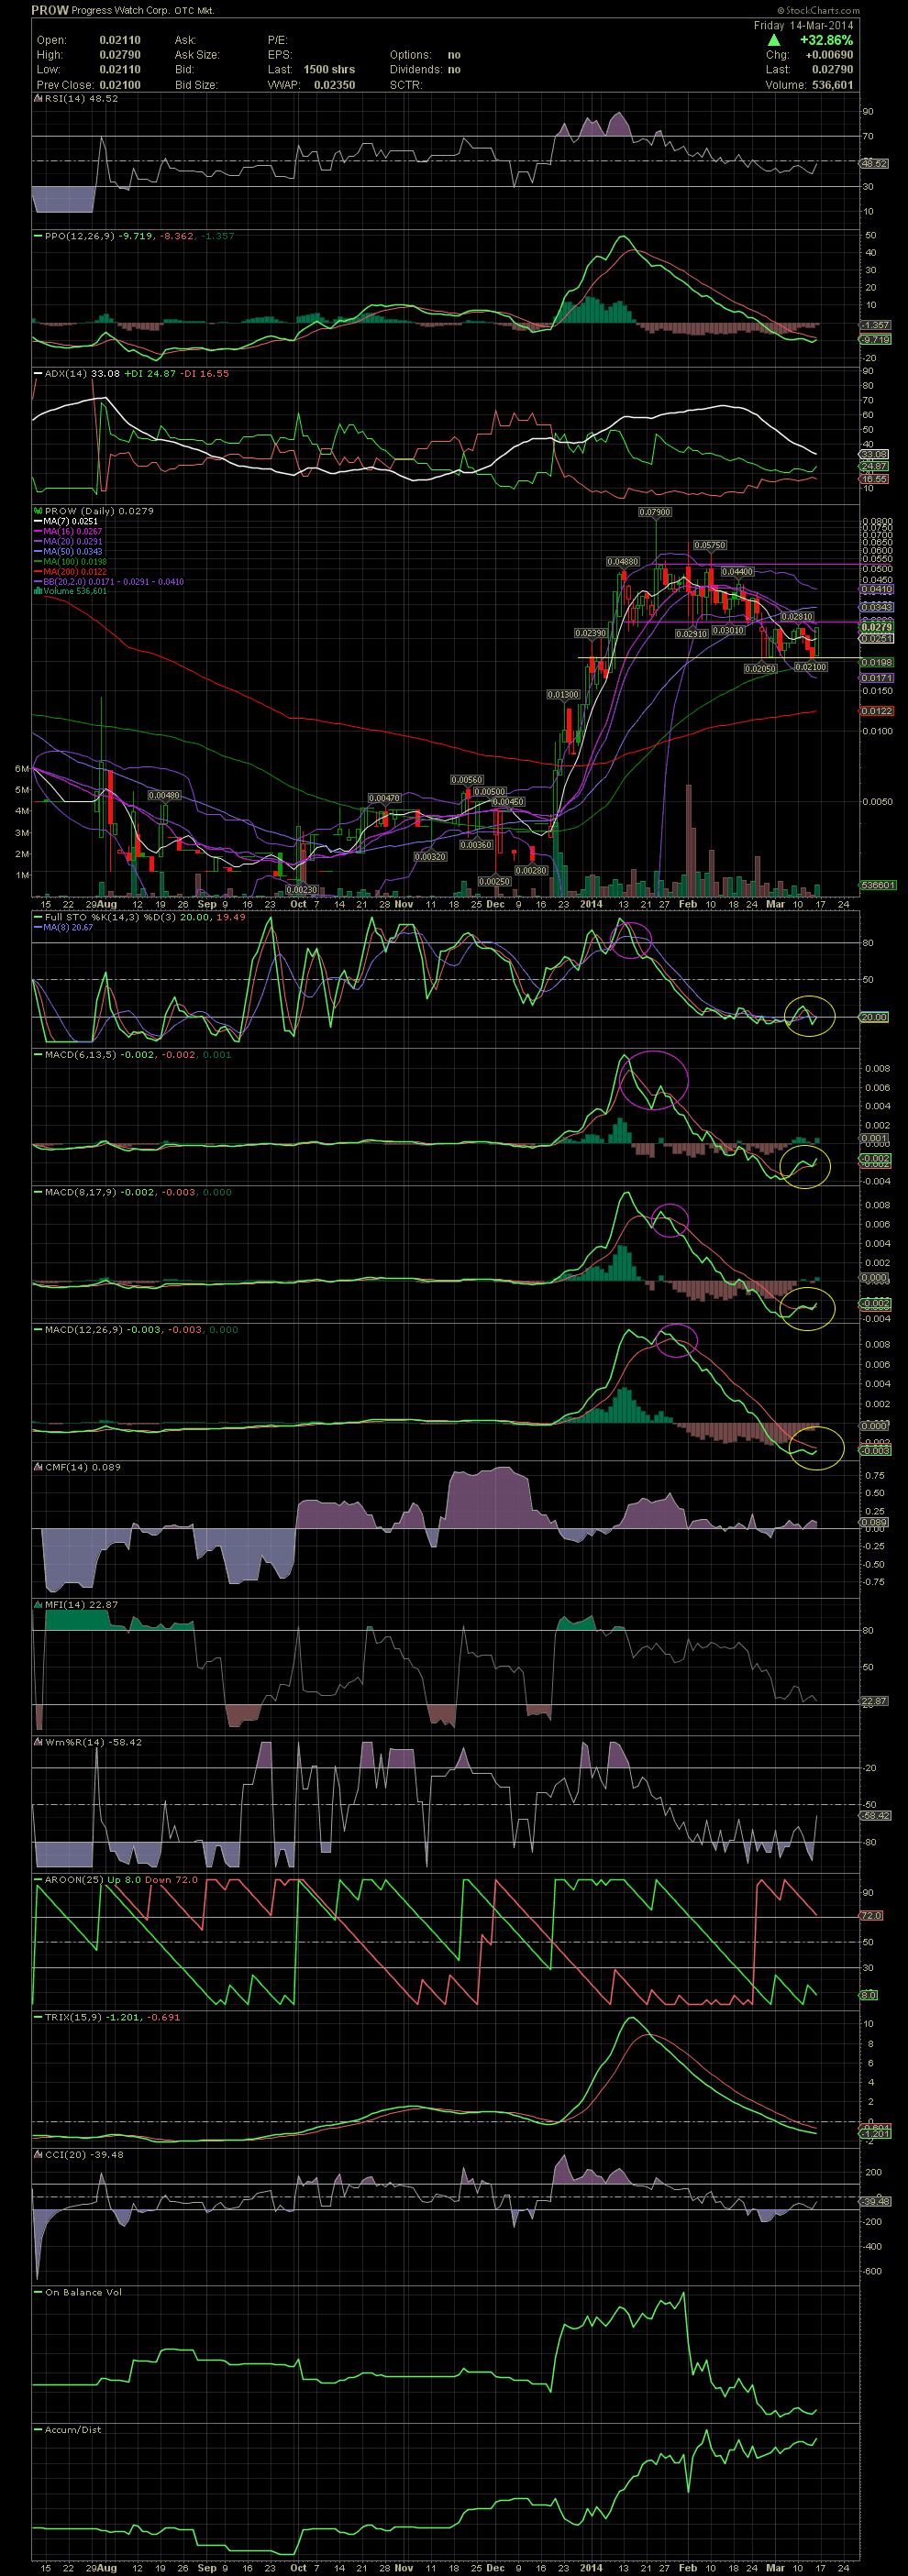
PROW Daily Chart ~ Trending Sideways Between .021 and .028
I added a few more shares on Thursday and Friday from .022 to .0245 in the hopes that a bottom has been established. As one can see on the chart, the .0205/.021 level has held for three weeks now. The lid on the upside has been .028/.0281. Friday's close at 0279 on increased volume is a sign that PROW might be ready for a break above the upper portion of the channel the stock has been trending in. I see an easy move to .044 and possibly into the .05s should the stock break above the horizontal resistance line and the MA50 which is stilling at .0343. The FullSto and MACDs are in oversold territory as they begin their positive crossovers. This could get interesting very quickly. GLTA
I added a few more shares on Thursday and Friday from .022 to .0245 in the hopes that a bottom has been established. As one can see on the chart, the .0205/.021 level has held for three weeks now. The lid on the upside has been .028/.0281. Friday's close at 0279 on increased volume is a sign that PROW might be ready for a break above the upper portion of the channel the stock has been trending in. I see an easy move to .044 and possibly into the .05s should the stock break above the horizontal resistance line and the MA50 which is stilling at .0343. The FullSto and MACDs are in oversold territory as they begin their positive crossovers. This could get interesting very quickly. GLTA