Posted On: 03/16/2014 7:08:25 PM
Post# of 2561

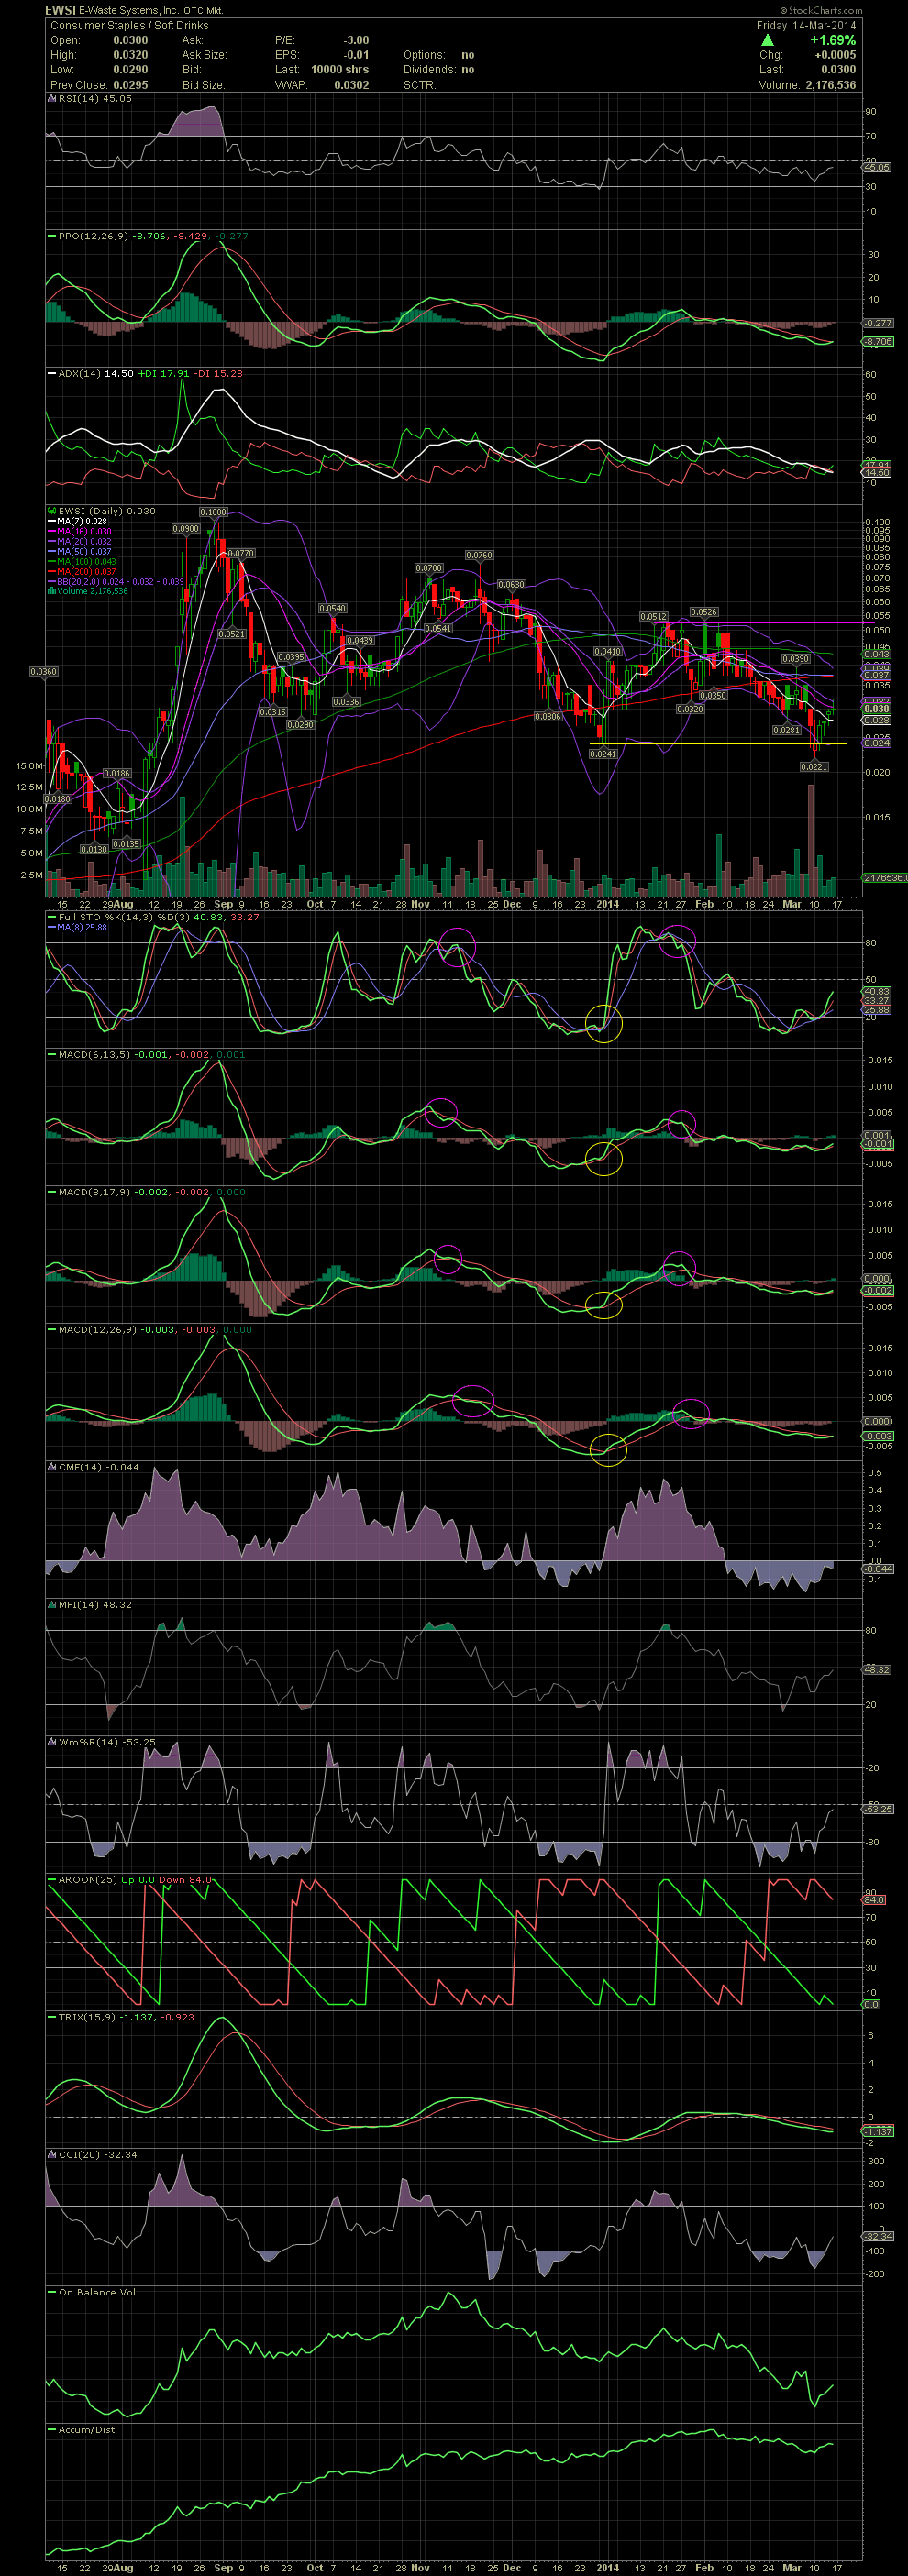
EWSI Daily Chart ~ Double Bottom Appears to Have Been Established
My entries at .025 to .027 are looking good so far. The potential double bottom at .024 (link back to my Mar 9 post) appears to have been established last week with an intraday drop below it to .0221 before recovering. EWSI needs to now close above the middle bollie/MA20 at .032 which would suggest a test of the MA50 and 200 at .037. The FullSto has already responded with the MACDs in a positive crossover and coming out of very oversold levels. GLTA
My entries at .025 to .027 are looking good so far. The potential double bottom at .024 (link back to my Mar 9 post) appears to have been established last week with an intraday drop below it to .0221 before recovering. EWSI needs to now close above the middle bollie/MA20 at .032 which would suggest a test of the MA50 and 200 at .037. The FullSto has already responded with the MACDs in a positive crossover and coming out of very oversold levels. GLTA