Posted On: 03/09/2014 11:58:36 PM
Post# of 2561

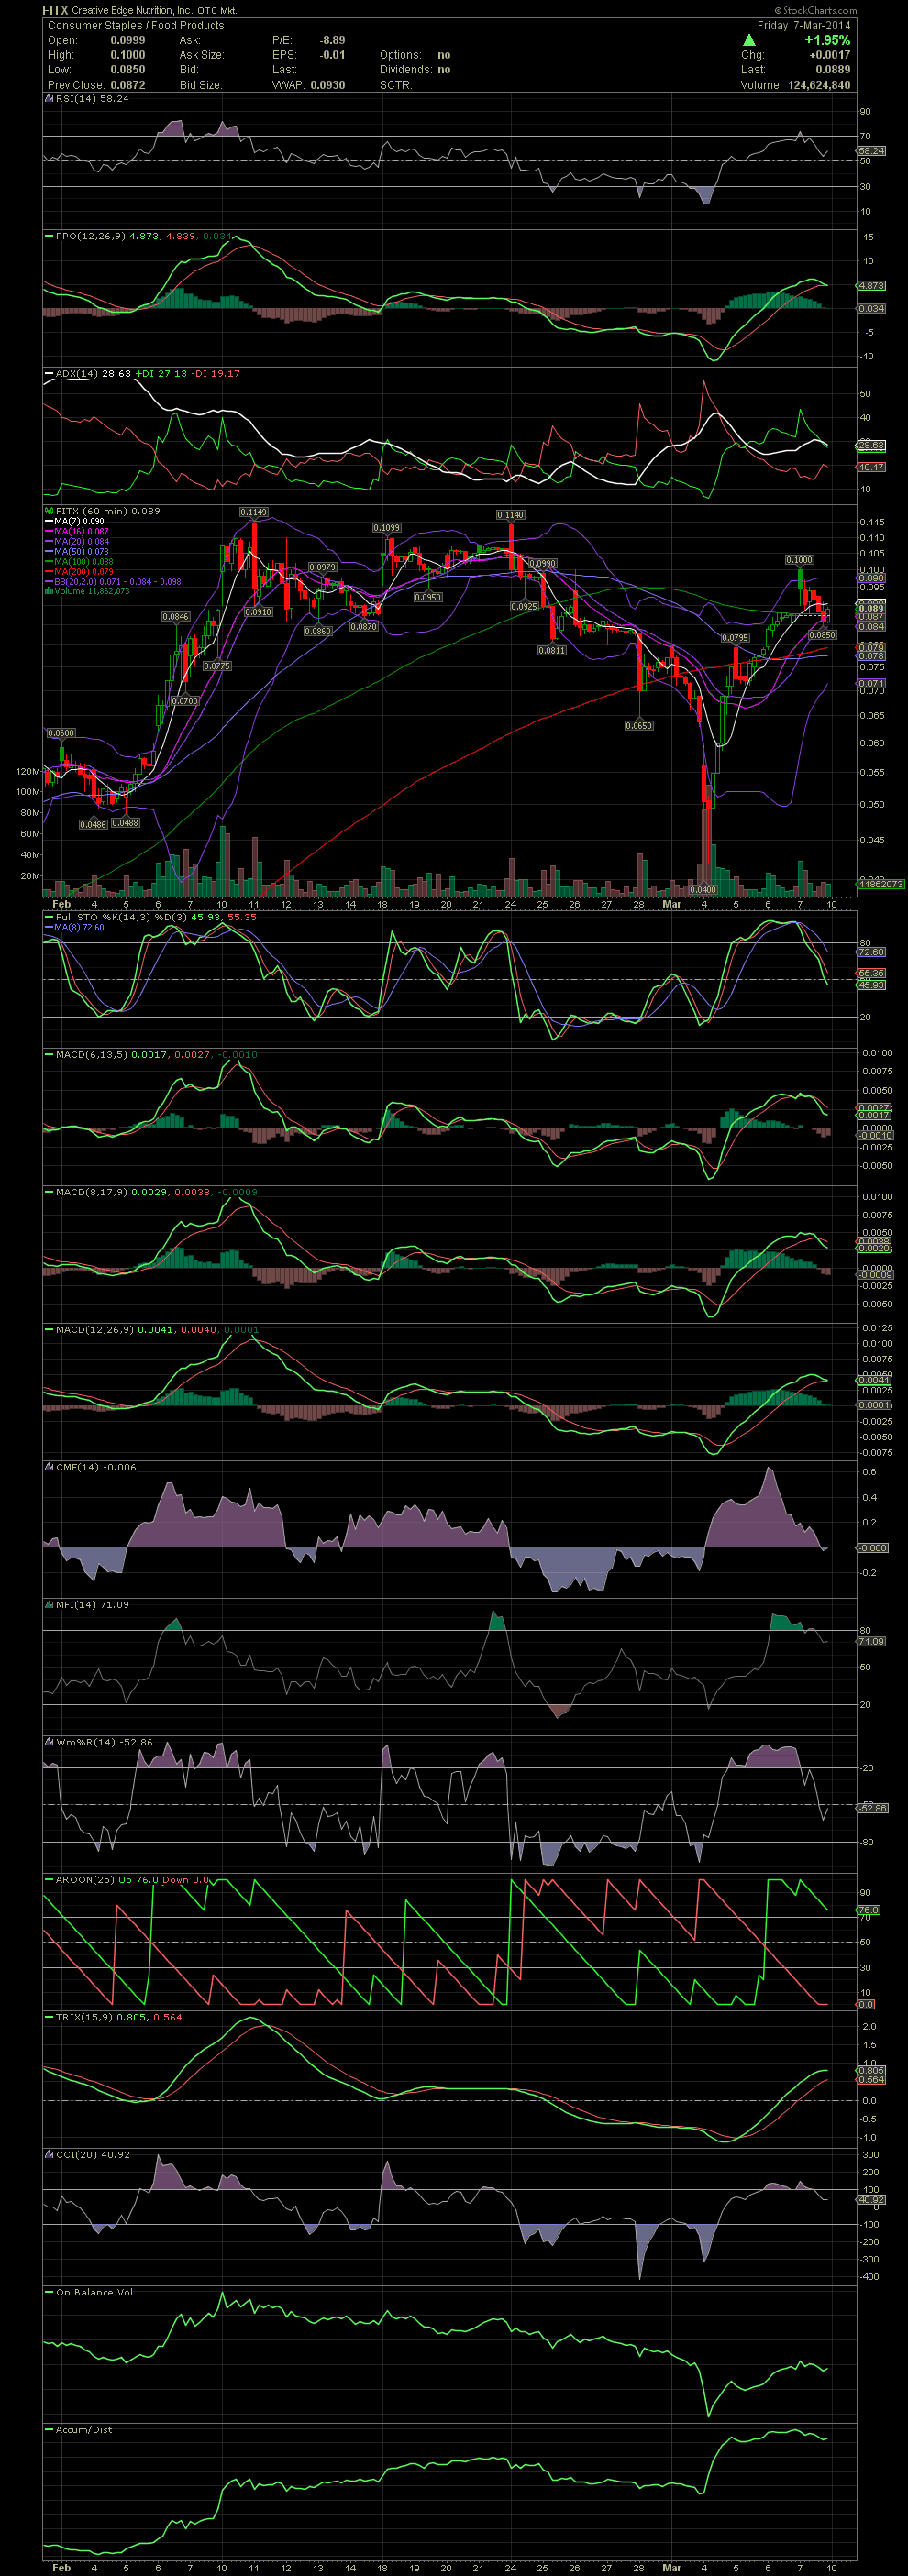
FITX 60 Minute Chart ~ Big Reversal from a Bear Raid on March 4
Here's a look at the hourly chart of FITX which can be quite useful for those that have the time to follow their short term trades during the day. When the stock closed just under the previous highs of .065 (see my previous daily chart) on Monday, it was possible that a Tuesday morning dump might occur. Sure enough. FITX dropped quickly to .04. Note the position of the candles outside the lower bollie. Also look at the oversold levels of the FullSto and MACDs. These indicators work just as well on shorter time periods, such as the 60 minute chart, as they do with the daily charts. An obvious exit for a real flipper would have been Friday morning when the candle traded outside the upper bollie. GLTA
Here's a look at the hourly chart of FITX which can be quite useful for those that have the time to follow their short term trades during the day. When the stock closed just under the previous highs of .065 (see my previous daily chart) on Monday, it was possible that a Tuesday morning dump might occur. Sure enough. FITX dropped quickly to .04. Note the position of the candles outside the lower bollie. Also look at the oversold levels of the FullSto and MACDs. These indicators work just as well on shorter time periods, such as the 60 minute chart, as they do with the daily charts. An obvious exit for a real flipper would have been Friday morning when the candle traded outside the upper bollie. GLTA