Posted On: 02/19/2014 6:40:51 PM
Post# of 36729
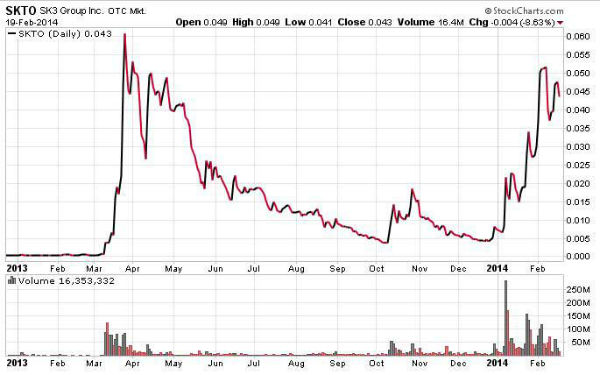
This chart can explain why the .05 area offers such stubborn resistance to the upside. There were two months of trading in 2013 from about mid March to mid May where the price, with one exceptional short-lived dip to .0275, traded between .04 and .05. Cumulatively, it adds up to a good amount of volume Those long holders, after almost a year, are finally in the money at about .05+/-. Once they are cleared out, SKTO could climb nicely. That can also explain why the shorts and bashers intensify attacks at that level. They know that there are a lot of longs in that boat drifting underwater for nearly a year, and it's easy to rattle them into selling. However, the best for SKTO is yet to come.
SKTO

SKTO

