Posted On: 02/12/2014 7:37:02 PM
Post# of 1456

FWDG chart:
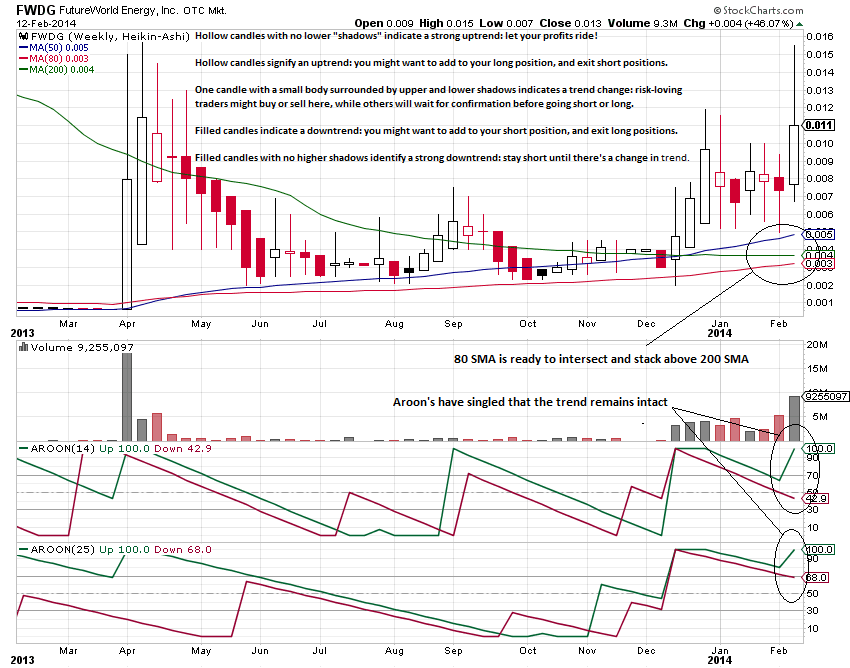
Here's a "weekly" view using a Heikin-Ashi candle view. Note the change in volume compared to last April's "hit and run". It's an established trading pattern. The gem with the Heikin-Ashi is that there are only two directional candles, two strong directional candles...and one "uncertain" candle. By using this view, I was able to just sit back and watch others fail.
Now ...look at the daily:
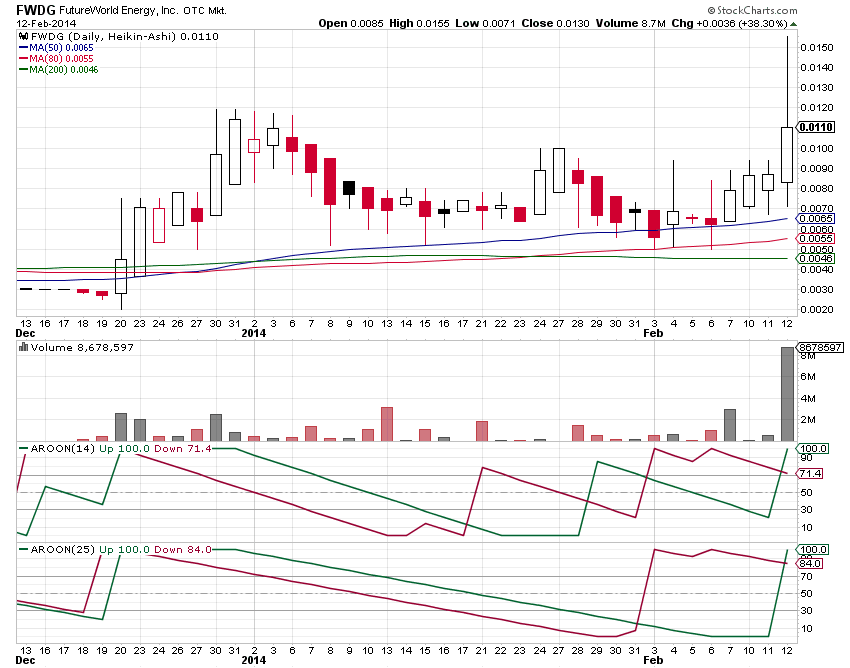
If you get it........you'll see that this one is in play............and never was "not" in play. Let's see how it unfolds with a little bit of patience.
p.s...sorry for any spelling errors. I tend to be a bit dis'....to say the least...it comes with age
Here's a "weekly" view using a Heikin-Ashi candle view. Note the change in volume compared to last April's "hit and run". It's an established trading pattern. The gem with the Heikin-Ashi is that there are only two directional candles, two strong directional candles...and one "uncertain" candle. By using this view, I was able to just sit back and watch others fail.
Now ...look at the daily:
If you get it........you'll see that this one is in play............and never was "not" in play. Let's see how it unfolds with a little bit of patience.
p.s...sorry for any spelling errors. I tend to be a bit dis'....to say the least...it comes with age