Posted On: 02/09/2014 5:07:23 PM
Post# of 2561

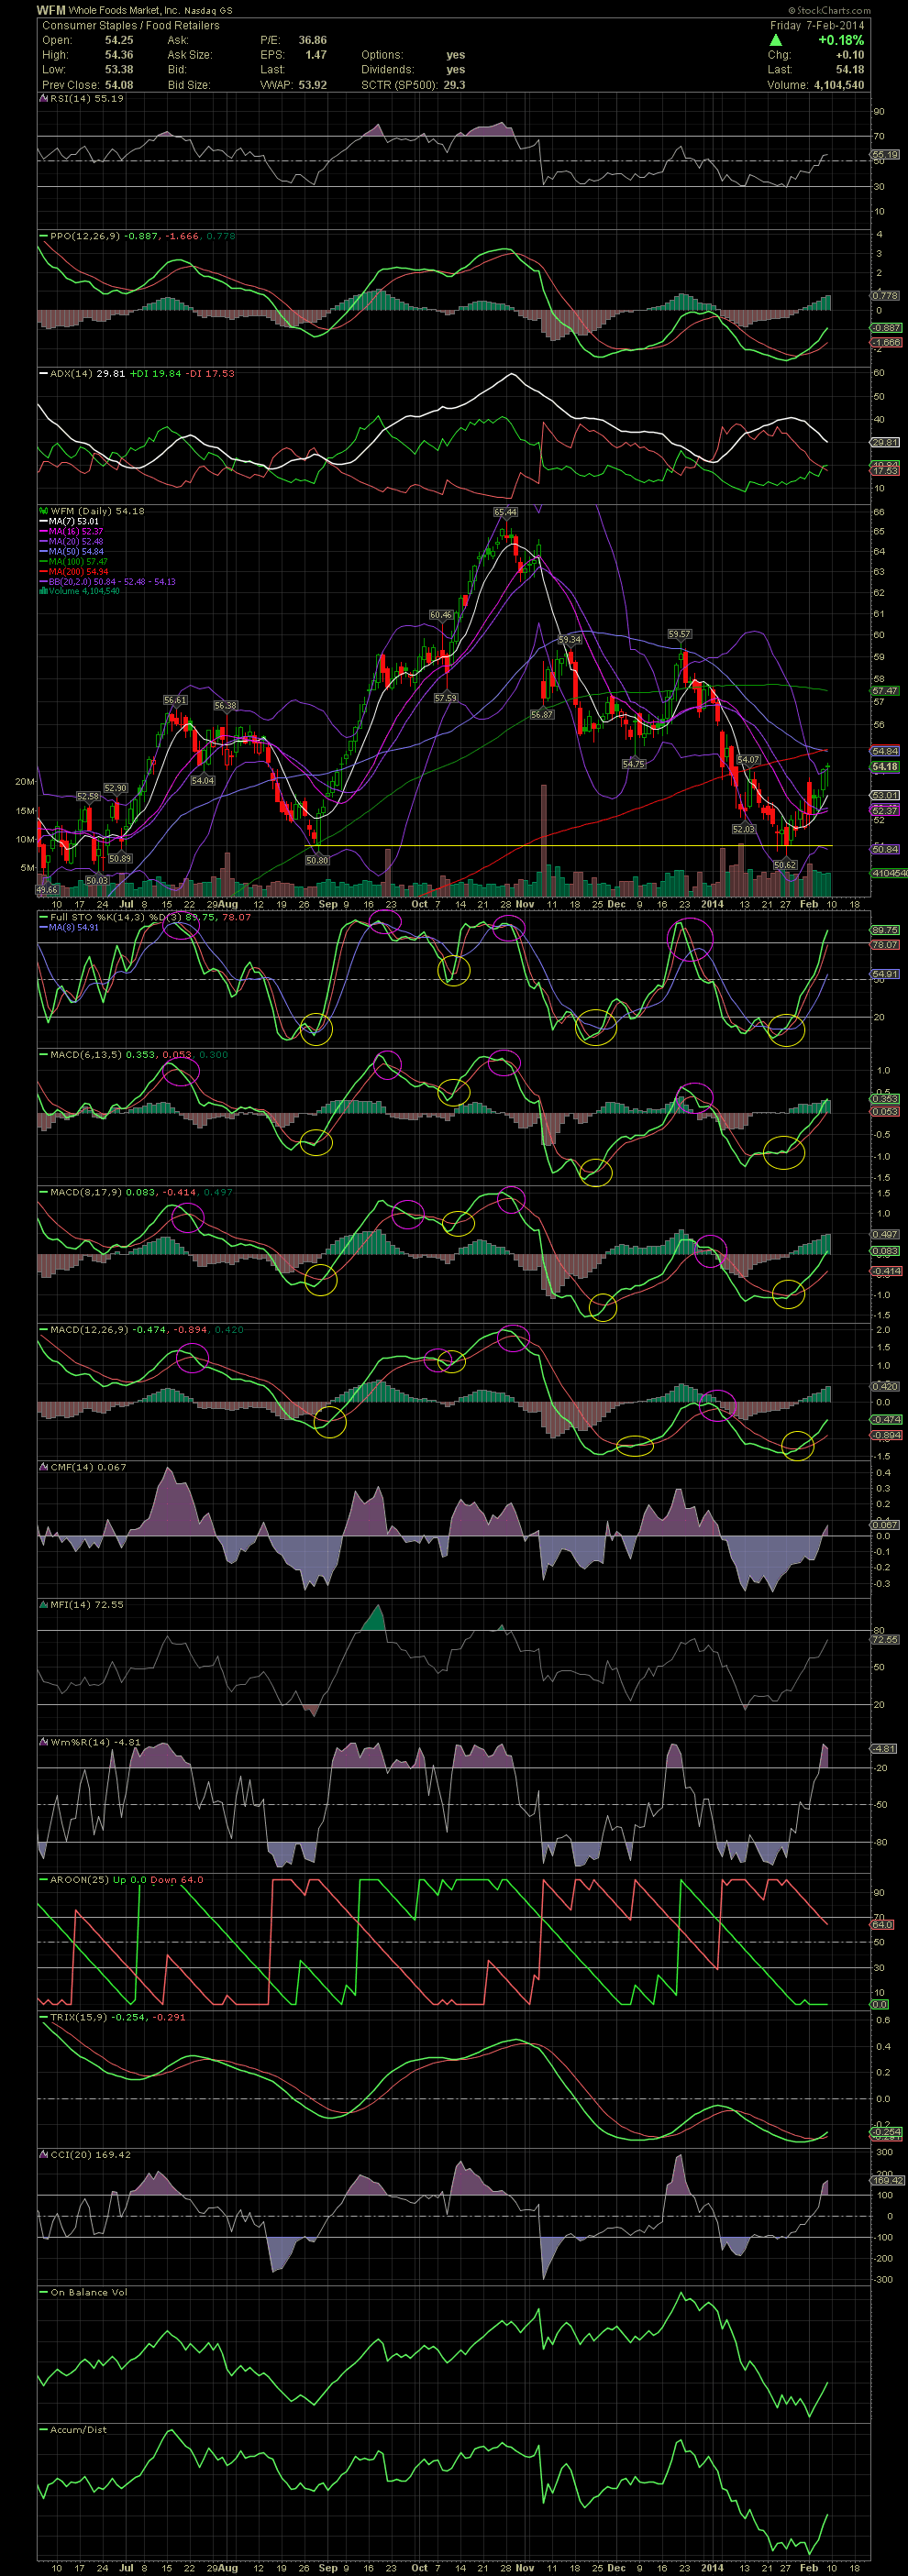
WFM Daily Chart ~ Picture Perfect Swing Trading Stock
Here is one of the better charts for those new to swing trading. Just follow the crossovers of the FullSto and MACDs. When all occur within a very short period of time, it's game on. When a stock is falling, keep your eyes on the indicators along with possible support levels on the chart such as occurred two weeks ago when WFM found support at its major bottom of August. As the stock approached the 50.00s, look at the oversold levels of the FullSto and MACDs. It was almost a no-brainer for those familiar with charting the Big Boards. GLTA
Here is one of the better charts for those new to swing trading. Just follow the crossovers of the FullSto and MACDs. When all occur within a very short period of time, it's game on. When a stock is falling, keep your eyes on the indicators along with possible support levels on the chart such as occurred two weeks ago when WFM found support at its major bottom of August. As the stock approached the 50.00s, look at the oversold levels of the FullSto and MACDs. It was almost a no-brainer for those familiar with charting the Big Boards. GLTA