Posted On: 02/09/2014 3:39:08 PM
Post# of 2561

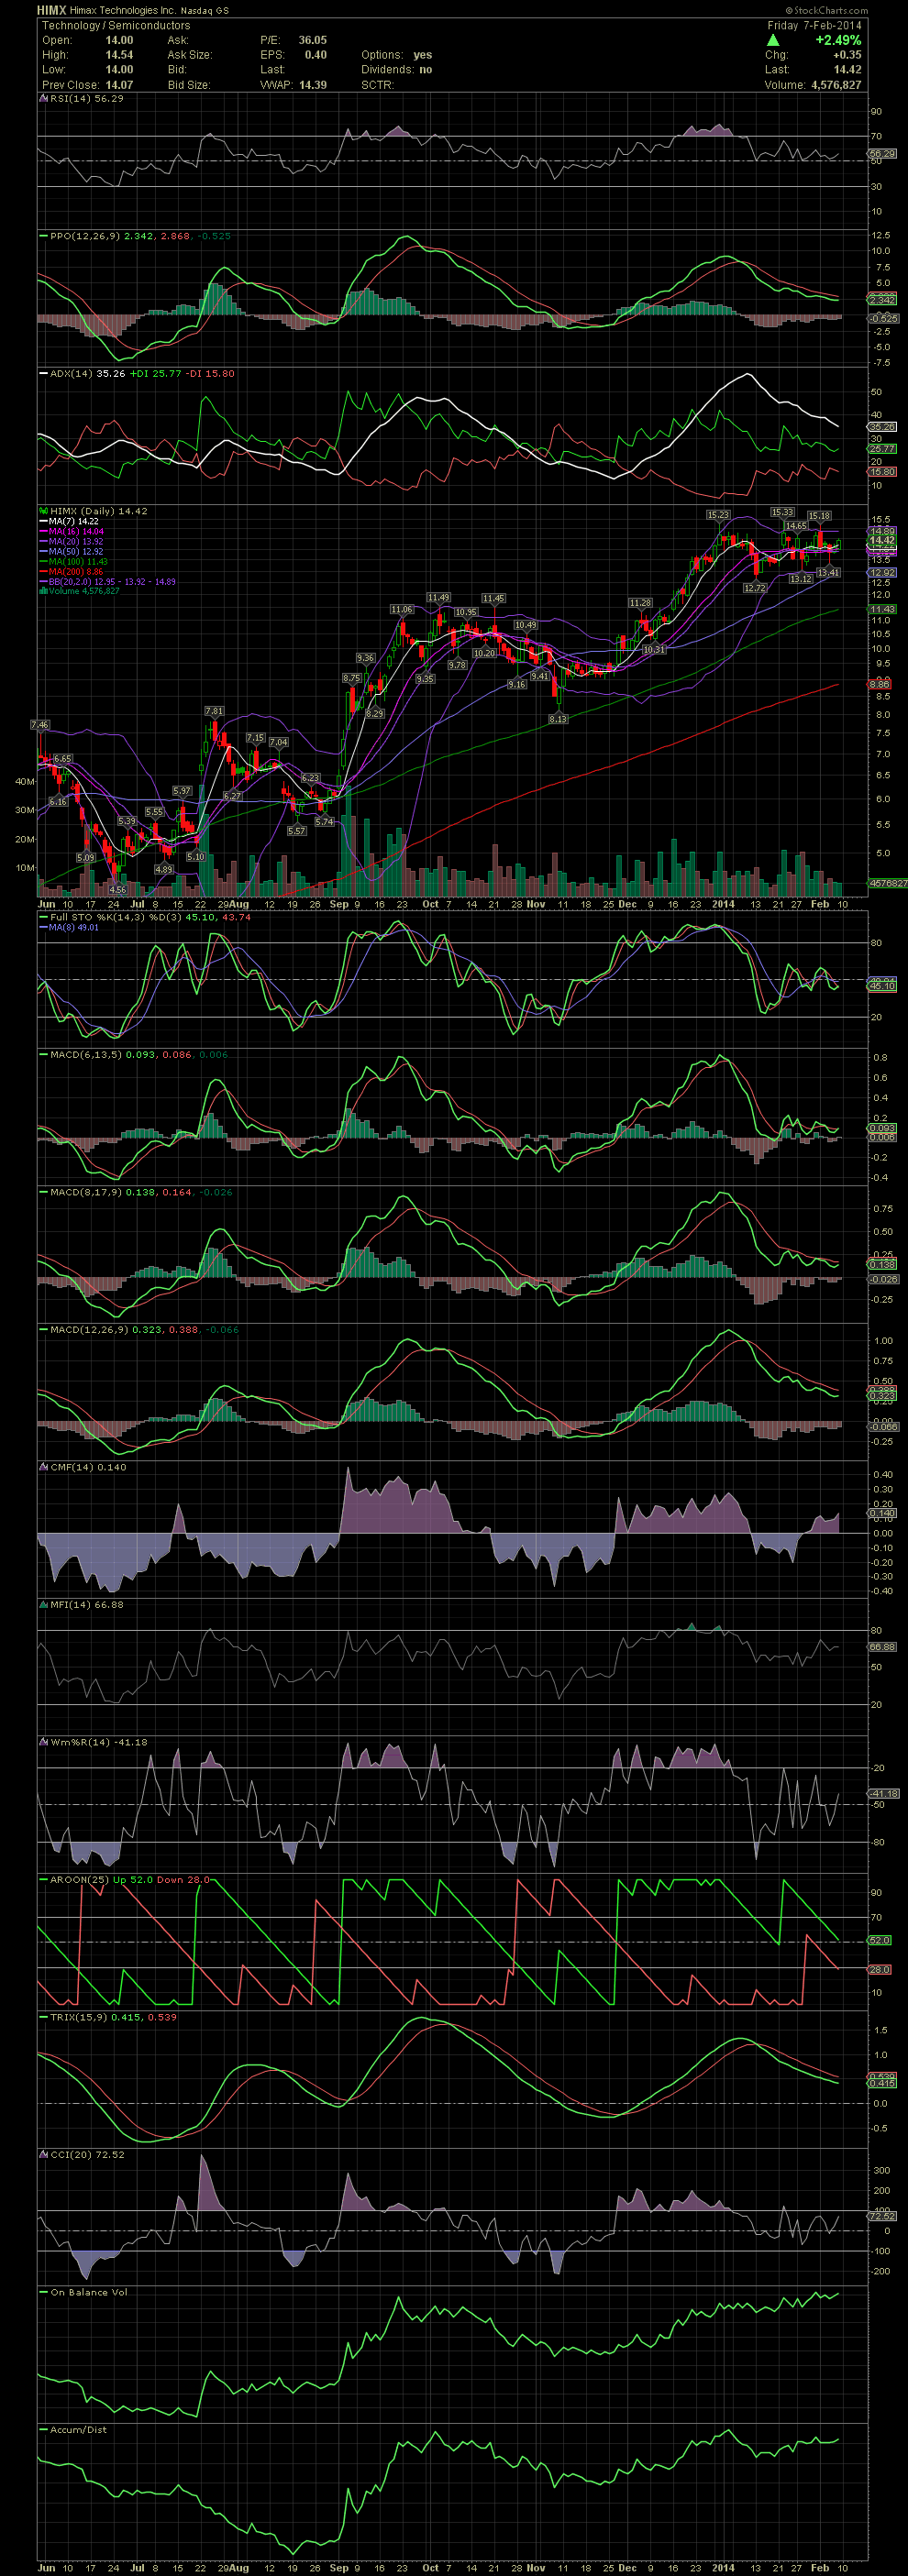
HIMX Daily Chart ~ An Example of Channeling
I'm currently not in HIMX. I'm posting this chart to show that even though the FullSto and MACDs are dropping, sometimes it doesn't have to relate to a sharp drop in share prices. In the case of HIMX, the stock has been trading in a narrow channel and holding well despite the falling indicators. Again, one never can predict if a stock is going to drop nor how far, but when the indicators cross to the downside, why risk the capital on the unknown. A sideways move is normally the best case scenario when indicators go south. That said, HIMX is undergoing some great consolidation. Should the share price hold up while the indicators reset to a buy signal, the stock should react nicely to the upside at that time. GLTA
I'm currently not in HIMX. I'm posting this chart to show that even though the FullSto and MACDs are dropping, sometimes it doesn't have to relate to a sharp drop in share prices. In the case of HIMX, the stock has been trading in a narrow channel and holding well despite the falling indicators. Again, one never can predict if a stock is going to drop nor how far, but when the indicators cross to the downside, why risk the capital on the unknown. A sideways move is normally the best case scenario when indicators go south. That said, HIMX is undergoing some great consolidation. Should the share price hold up while the indicators reset to a buy signal, the stock should react nicely to the upside at that time. GLTA