Posted On: 02/09/2014 3:27:06 PM
Post# of 2561

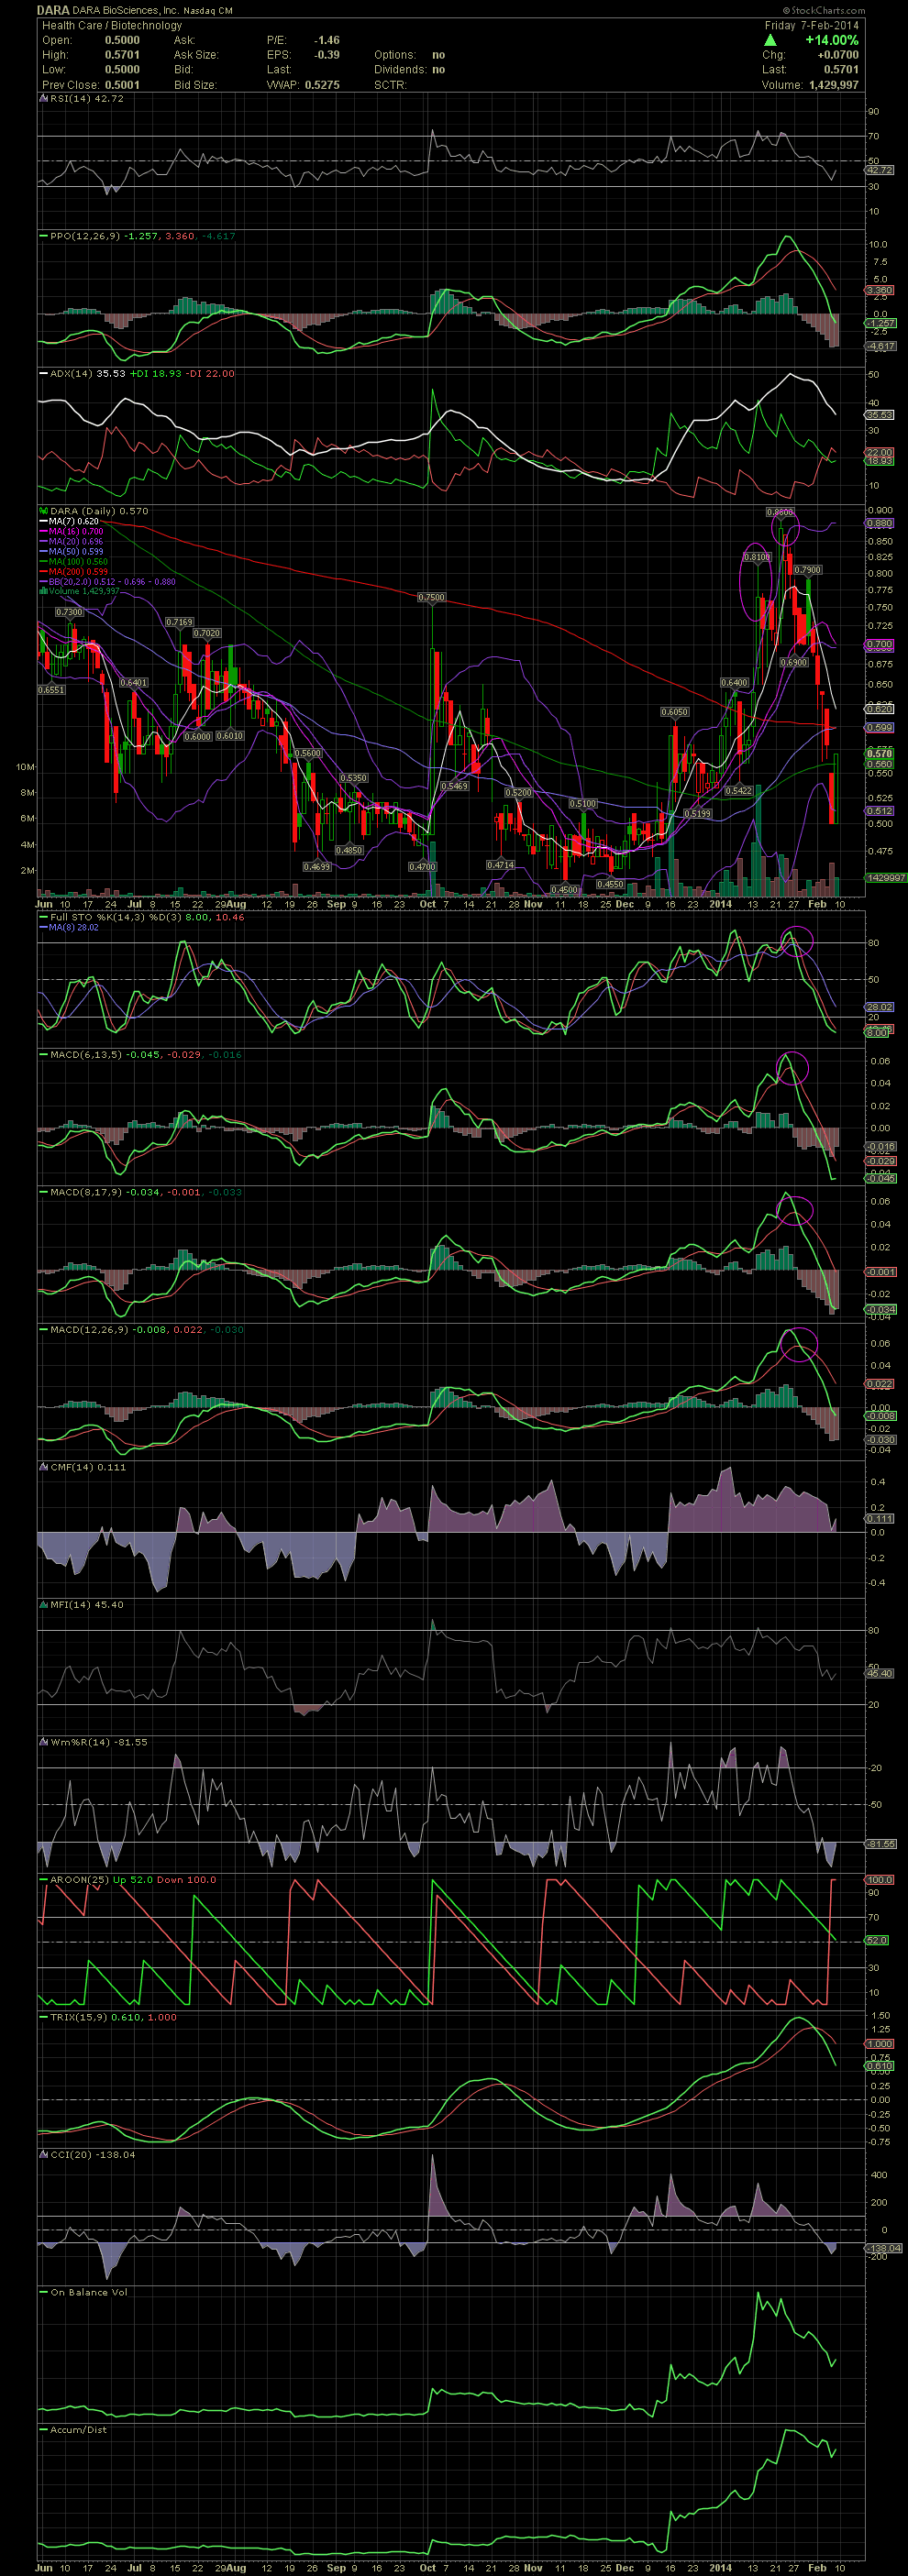
DARA Daily Chart ~ Another Lesson in Following the Indicators
Although I sold DARA way to early, a few friends held onto their .50s/.60s and sold into the high .80s. Sticking with the outside the upper bollie and the negative crossovers of the FullSto and MACD, they did very well with their exits. Some of them moved funds back into the stock on Friday when the .50 held. The .48/.51 tops of Nov/Dec, which were acting as resistance levels back then, has become a support level now. A calculated risk/reward entry has proven to be a good move so far. Remember, a move from .50 to .60 is 20%. Not bad. The previous swing trades from the .50s to the .80s was even more impressive. Nice trading guys! GLTA
Although I sold DARA way to early, a few friends held onto their .50s/.60s and sold into the high .80s. Sticking with the outside the upper bollie and the negative crossovers of the FullSto and MACD, they did very well with their exits. Some of them moved funds back into the stock on Friday when the .50 held. The .48/.51 tops of Nov/Dec, which were acting as resistance levels back then, has become a support level now. A calculated risk/reward entry has proven to be a good move so far. Remember, a move from .50 to .60 is 20%. Not bad. The previous swing trades from the .50s to the .80s was even more impressive. Nice trading guys! GLTA