Posted On: 02/02/2014 9:03:50 PM
Post# of 338556

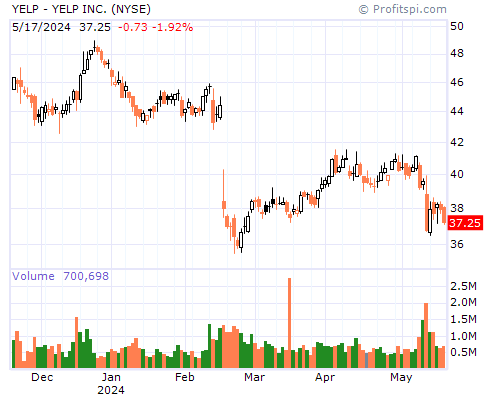
YELP Stock Chart and Technical Analysis - Sun, Feb 2nd, 2014 $YELP
Period Moving Average Price Change Percent Change Average Volume
5 Day 74.38 -0.04 -0.05% 3,177,840
20 Day 77.18 +8.03 +11.82% 3,146,430
50 Day 69.41 +11.52 +17.88% 2,768,732
100 Day 68.47 +14.04 +22.68% 3,268,787
200 Day 53.19 +49.85 +191.00% 2,802,550
Year to Date 76.74 +7.00 +10.15% 3,087,576
Period Raw Stochastic Stochastic %K Stochastic %D Average True Range
9 Day 43.43% 32.89% 30.73% 4.06
14 Day 43.43% 32.89% 30.73% 3.90
20 Day 54.20% 46.36% 47.03% 3.78
50 Day 70.67% 65.20% 64.08% 3.44
100 Day 70.67% 65.20% 64.85% 2.96
Period Relative Strength Percent R Historic Volatility MACD Oscillator
9 Day 50.21% 56.57% 57.64% -2.30
14 Day 52.44% 56.57% 65.78% -3.58
20 Day 53.70% 45.80% 66.88% -2.72
50 Day 55.26% 29.33% 54.13% +5.04
100 Day 56.27% 29.33% 57.31% +5.99