Posted On: 01/30/2014 12:02:33 PM
Post# of 338556

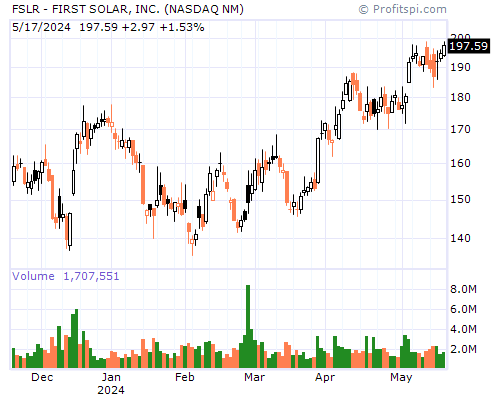
FSLR Stock Chart and Technical Analysis - Thu, Jan 30th, 2014 $FSLR
Period Moving Average Price Change Percent Change Average Volume
5 Day 11.78 -0.08 -0.66% 32,329,486
20 Day 11.13 +1.36 +12.79% 40,044,277
50 Day 10.25 +2.96 +32.78% 28,506,025
100 Day 9.45 +4.07 +51.39% 28,354,223
200 Day 8.81 +3.89 +48.02% 22,941,178
Year to Date 11.13 +1.36 +12.79% 40,044,277
Period Moving Average Price Change Percent Change Average Volume
5 Day 11.78 -0.08 -0.66% 32,329,486
20 Day 11.13 +1.36 +12.79% 40,044,277
50 Day 10.25 +2.96 +32.78% 28,506,025
100 Day 9.45 +4.07 +51.39% 28,354,223
200 Day 8.81 +3.89 +48.02% 22,941,178
Year to Date 11.13 +1.36 +12.79% 40,044,277