Posted On: 01/30/2014 11:18:13 AM
Post# of 338556

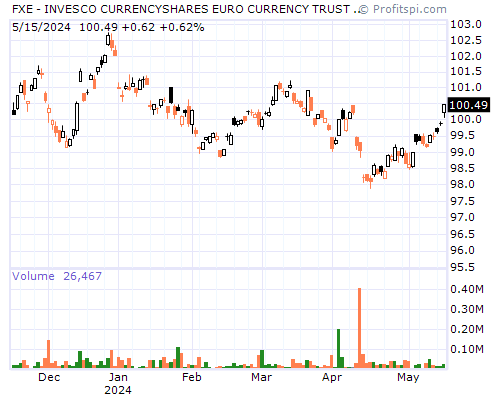
FXE Stock Chart and Technical Analysis - Thu, Jan 30th, 2014 $FXE
Period Moving Average Price Change Percent Change Average Volume
5 Day 11.76 -0.18 -1.49% 31,760,984
20 Day 11.12 +1.26 +11.85% 39,902,152
50 Day 10.25 +2.86 +31.67% 28,449,174
100 Day 9.45 +3.97 +50.13% 28,325,797
200 Day 8.81 +3.79 +46.79% 22,926,965
Year to Date 11.12 +1.26 +11.85% 39,902,152
Period Raw Stochastic Stochastic %K Stochastic %D Average True Range
9 Day 66.67% 74.57% 72.79% 0.40
14 Day 82.73% 83.53% 78.85% 0.37
20 Day 82.73% 83.53% 78.85% 0.34
50 Day 87.32% 87.96% 84.83% 0.28
100 Day 90.44% 90.90% 88.43% 0.24
Period Relative Strength Percent R Historic Volatility MACD Oscillator
9 Day 64.12% 33.33% 48.07% +0.07
14 Day 65.14% 17.27% 50.32% +0.57
20 Day 65.38% 17.27% 43.95% +0.79
50 Day 63.67% 12.68% 32.05% +1.66
100 Day 60.28% 9.56% 34.26% +2.46