Posted On: 01/28/2014 4:10:47 PM
Post# of 338556

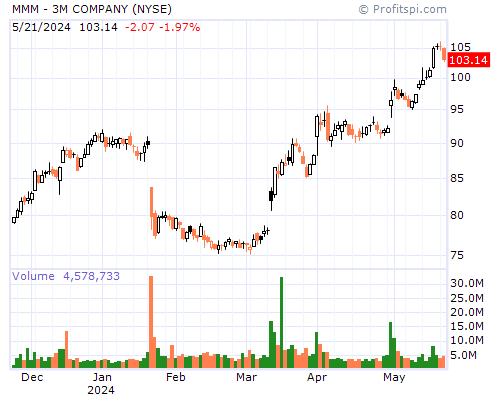
MMM Stock Chart and Technical Analysis - Tue, Jan 28th, 2014 $MMM
Period Moving Average Price Change Percent Change Average Volume
5 Day 11.85 -0.25 -2.06% 43,803,988
20 Day 10.99 +1.19 +11.13% 38,424,953
50 Day 10.13 +2.89 +32.15% 27,952,695
100 Day 9.37 +4.04 +51.53% 28,177,053
200 Day 8.77 +3.66 +44.53% 22,930,033
Year to Date 11.03 +1.25 +11.76% 41,297,809
Period Raw Stochastic Stochastic %K Stochastic %D Average True Range
9 Day 77.55% 69.10% 74.91% 0.40
14 Day 82.33% 73.23% 77.51% 0.36
20 Day 82.33% 73.23% 77.51% 0.33
50 Day 87.17% 81.03% 84.14% 0.27
100 Day 90.24% 85.46% 87.84% 0.23
Period Relative Strength Percent R Historic Volatility MACD Oscillator
9 Day 65.55% 22.45% 48.86% +0.06
14 Day 66.13% 17.67% 51.28% +0.48
20 Day 66.12% 17.67% 44.36% +0.67
50 Day 63.99% 12.83% 31.95% +1.52
100 Day 60.38% 9.76% 34.21% +2.29