Posted On: 01/28/2014 11:40:07 AM
Post# of 338556

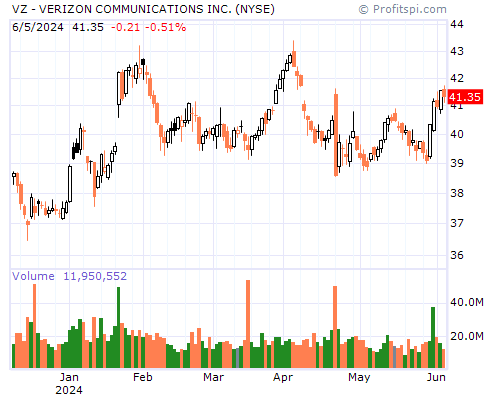
VZ Stock Chart and Technical Analysis - Tue, Jan 28th, 2014 $VZ
Period Moving Average Price Change Percent Change Average Volume
5 Day 11.84 -0.31 -2.56% 42,175,586
20 Day 10.98 +1.13 +10.57% 38,017,852
50 Day 10.13 +2.83 +31.48% 27,789,854
100 Day 9.37 +3.98 +50.77% 28,095,633
200 Day 8.77 +3.60 +43.80% 22,889,324
Year to Date 11.03 +1.19 +11.19% 40,845,473
Period Raw Stochastic Stochastic %K Stochastic %D Average True Range
9 Day 74.49% 68.08% 74.57% 0.40
14 Day 79.92% 72.42% 77.24% 0.36
20 Day 79.92% 72.42% 77.24% 0.33
50 Day 85.42% 80.45% 83.94% 0.27
100 Day 88.91% 85.02% 87.69% 0.23
Period Relative Strength Percent R Historic Volatility MACD Oscillator
9 Day 64.70% 25.51% 48.91% +0.04
14 Day 65.52% 20.08% 51.14% +0.46
20 Day 65.64% 20.08% 44.18% +0.65
50 Day 63.72% 14.58% 31.86% +1.50
100 Day 60.19% 11.09% 34.16% +2.27