Posted On: 01/28/2014 10:25:21 AM
Post# of 338556

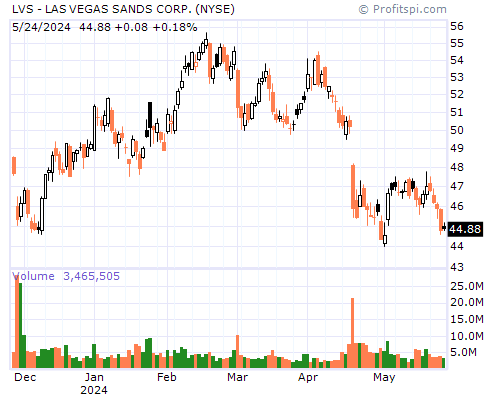
LVS Stock Chart and Technical Analysis - Tue, Jan 28th, 2014 $LVS
Period Moving Average Price Change Percent Change Average Volume
5 Day 11.84 -0.32 -2.64% 41,423,785
20 Day 10.98 +1.12 +10.48% 37,829,902
50 Day 10.13 +2.82 +31.37% 27,714,674
100 Day 9.36 +3.97 +50.64% 28,058,043
200 Day 8.77 +3.59 +43.67% 22,870,529
Year to Date 11.03 +1.18 +11.10% 40,636,641
Period Moving Average Price Change Percent Change Average Volume
5 Day 11.84 -0.32 -2.64% 41,423,785
20 Day 10.98 +1.12 +10.48% 37,829,902
50 Day 10.13 +2.82 +31.37% 27,714,674
100 Day 9.36 +3.97 +50.64% 28,058,043
200 Day 8.77 +3.59 +43.67% 22,870,529
Year to Date 11.03 +1.18 +11.10% 40,636,641