Posted On: 01/28/2014 12:41:57 AM
Post# of 338556

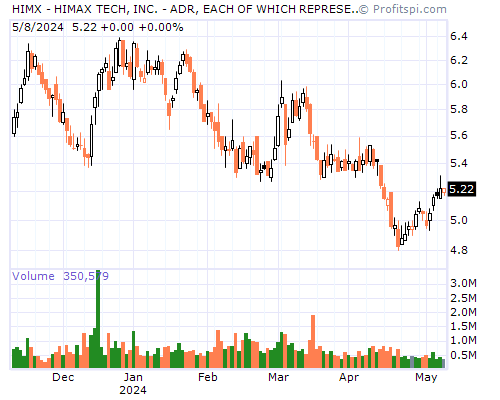
HIMX Stock Chart and Technical Analysis - Mon, Jan 27th, 2014 $HIMX
Period Moving Average Price Change Percent Change Average Volume
5 Day 14.23 +1.16 +8.67% 10,835,319
20 Day 13.99 +1.01 +7.46% 8,243,730
50 Day 12.06 +5.39 +58.91% 7,851,202
100 Day 10.92 +8.06 +124.38% 9,670,172
200 Day 8.56 +8.28 +132.27% 7,954,543
Year to Date 13.97 -0.17 -1.16% 8,014,153
Period Raw Stochastic Stochastic %K Stochastic %D Average True Range
9 Day 66.95% 54.50% 59.90% 0.79
14 Day 69.73% 55.43% 59.02% 0.75
20 Day 69.73% 55.43% 59.02% 0.71
50 Day 87.50% 81.85% 83.93% 0.62
100 Day 90.91% 87.18% 88.48% 0.53
Period Relative Strength Percent R Historic Volatility MACD Oscillator
9 Day 59.17% 33.05% 65.53% +0.28
14 Day 59.78% 30.27% 64.72% +0.29
20 Day 60.42% 30.27% 60.02% +0.17
50 Day 60.33% 12.50% 55.63% +2.11
100 Day 59.54% 9.09% 67.49% +3.25