Posted On: 01/28/2014 12:39:44 AM
Post# of 338556

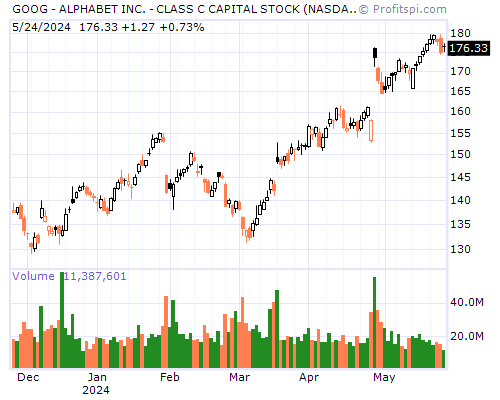
GOOG Stock Chart and Technical Analysis - Mon, Jan 27th, 2014 $GOOG
Period Moving Average Price Change Percent Change Average Volume
5 Day 1,142.78 -49.30 -4.28% 2,758,820
20 Day 1,133.31 -16.23 -1.45% 2,178,070
50 Day 1,091.25 +89.45 +8.84% 1,794,484
100 Day 1,011.42 +240.85 +27.99% 1,859,357
200 Day 941.52 +310.84 +39.33% 2,019,602
Year to Date 1,136.33 -19.48 -1.74% 2,317,429
Period Raw Stochastic Stochastic %K Stochastic %D Average True Range
9 Day 22.14% 39.97% 65.60% 20.18
14 Day 22.14% 46.02% 70.22% 18.40
20 Day 22.14% 46.60% 70.62% 17.38
50 Day 58.70% 75.62% 87.39% 15.72
100 Day 79.48% 87.84% 93.70% 14.79
Period Relative Strength Percent R Historic Volatility MACD Oscillator
9 Day 34.04% 77.86% 24.40% -18.13
14 Day 43.00% 77.86% 21.90% -13.19
20 Day 48.97% 77.86% 19.64% -4.92
50 Day 57.63% 41.30% 15.94% +37.14
100 Day 58.82% 20.52% 25.38% +116.97