Posted On: 01/28/2014 12:38:14 AM
Post# of 338556

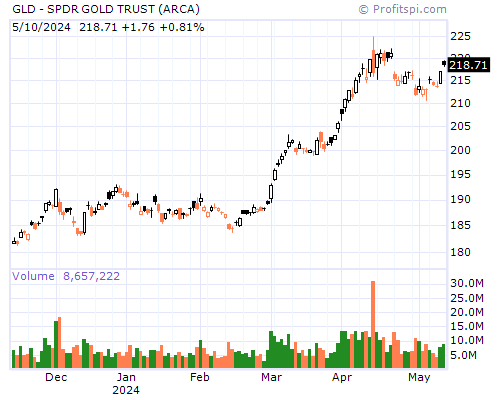
GLD Stock Chart and Technical Analysis - Mon, Jan 27th, 2014 $GLD
Period Moving Average Price Change Percent Change Average Volume
5 Day 120.79 +0.03 +0.02% 7,755,140
20 Day 119.32 +4.22 +3.61% 7,133,215
50 Day 119.43 -1.49 -1.22% 7,720,114
100 Day 123.64 -15.46 -11.33% 8,345,325
200 Day 127.56 -30.09 -19.92% 10,600,335
Year to Date 119.86 +4.84 +4.17% 6,994,423
Period Raw Stochastic Stochastic %K Stochastic %D Average True Range
9 Day 54.57% 80.16% 73.16% 1.44
14 Day 69.20% 86.87% 81.34% 1.49
20 Day 80.85% 91.73% 87.69% 1.54
50 Day 62.20% 69.09% 61.70% 1.71
100 Day 31.89% 33.26% 29.52% 1.83
Period Relative Strength Percent R Historic Volatility MACD Oscillator
9 Day 56.11% 45.43% 15.94% +1.21
14 Day 54.61% 30.80% 14.93% +1.62
20 Day 52.46% 19.15% 15.19% +2.36
50 Day 47.96% 37.80% 17.33% +2.25
100 Day 46.28% 68.11% 19.38% -1.96