Posted On: 01/28/2014 12:37:06 AM
Post# of 338556

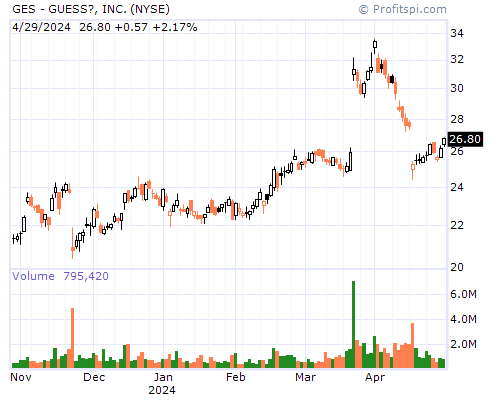
GES Stock Chart and Technical Analysis - Mon, Jan 27th, 2014 $GES
Period Moving Average Price Change Percent Change Average Volume
5 Day 28.39 -0.87 -2.98% 798,080
20 Day 29.68 -3.16 -10.04% 1,197,620
50 Day 31.54 -3.94 -12.22% 916,986
100 Day 31.09 -1.98 -6.54% 775,443
200 Day 30.70 +1.35 +5.01% 821,195
Year to Date 29.41 -2.77 -8.92% 1,350,488
Period Raw Stochastic Stochastic %K Stochastic %D Average True Range
9 Day 16.27% 9.49% 12.98% 0.77
14 Day 16.00% 8.35% 10.05% 0.78
20 Day 12.34% 7.13% 9.64% 0.77
50 Day 6.74% 3.85% 5.12% 0.75
100 Day 6.74% 4.03% 6.81% 0.74
Period Relative Strength Percent R Historic Volatility MACD Oscillator
9 Day 34.58% 83.73% 26.45% -0.63
14 Day 35.31% 84.00% 32.14% -0.88
20 Day 36.86% 87.66% 30.36% -1.49
50 Day 43.18% 93.26% 26.62% -3.34
100 Day 47.23% 93.26% 23.31% -2.89